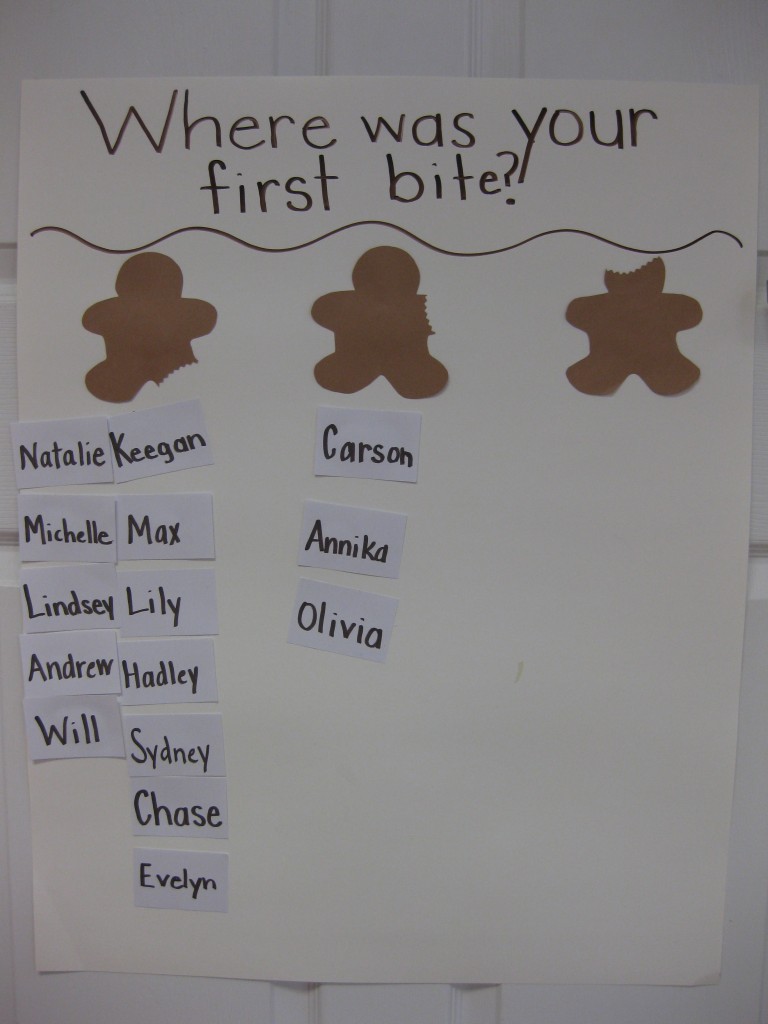
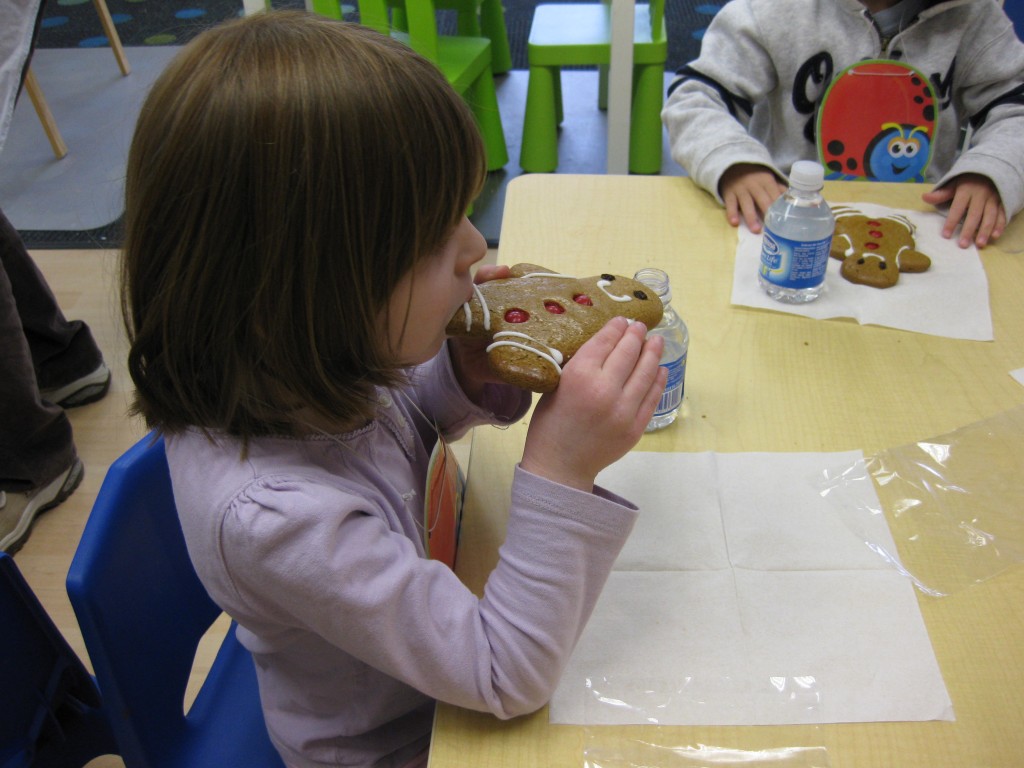
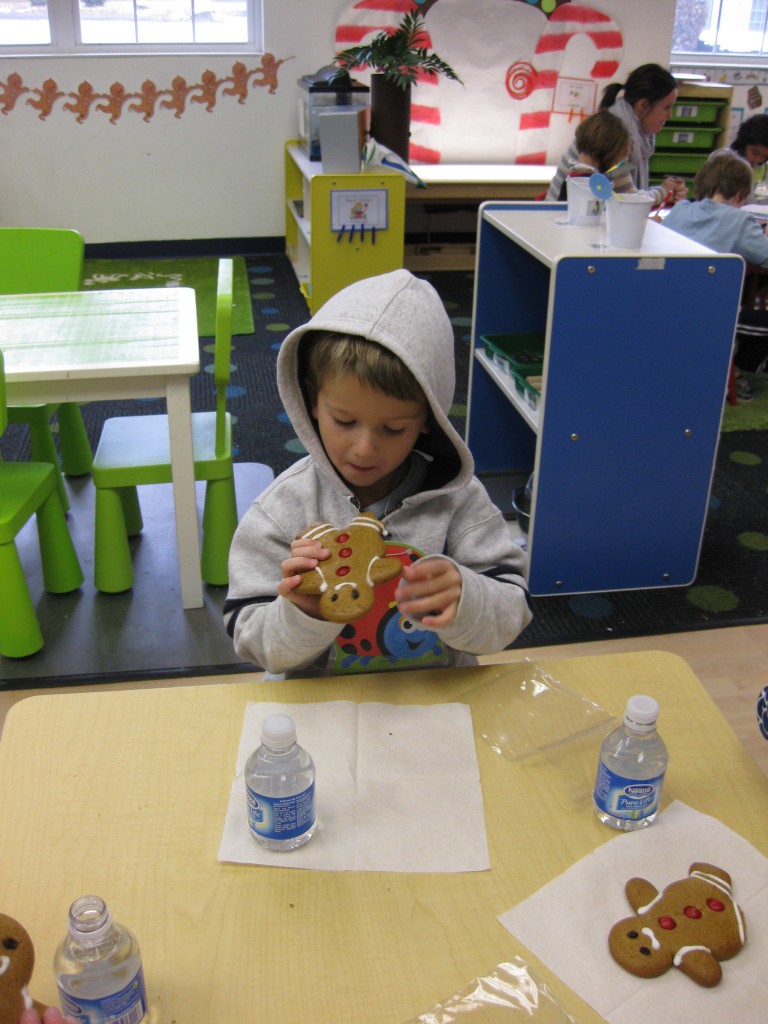
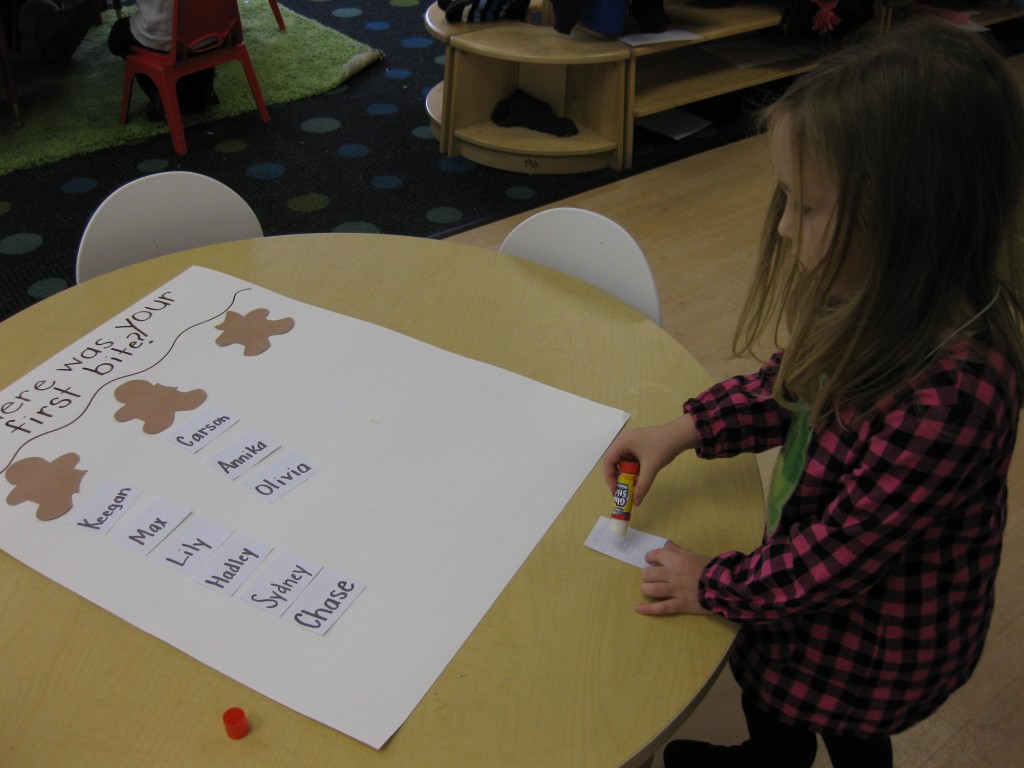
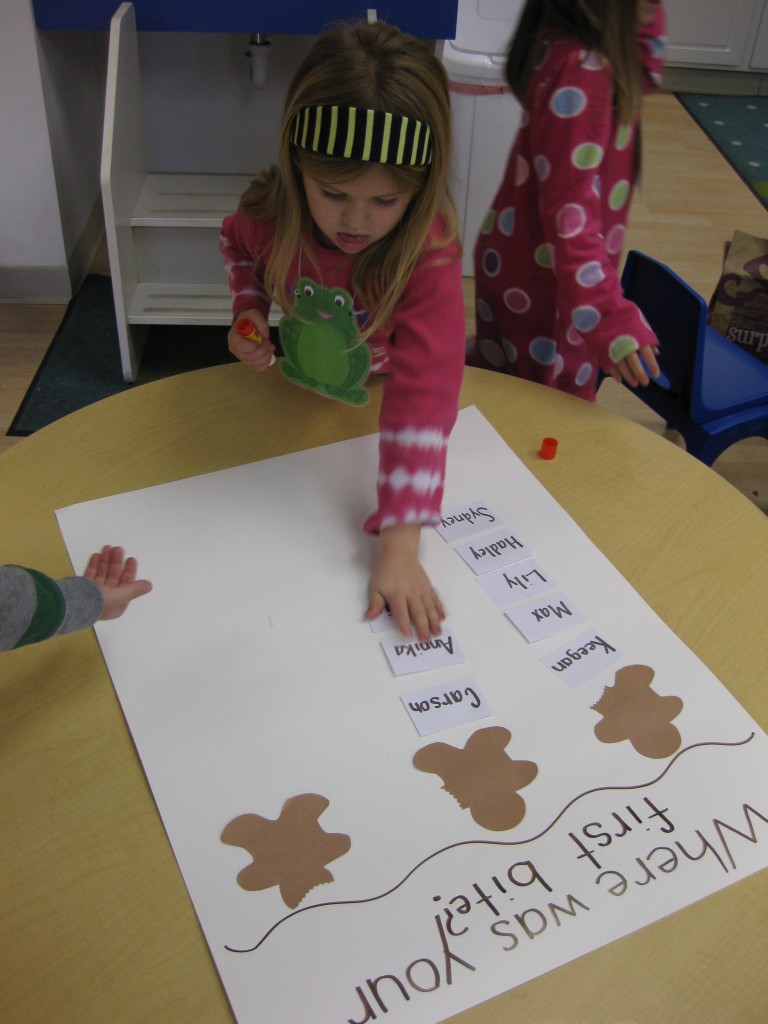
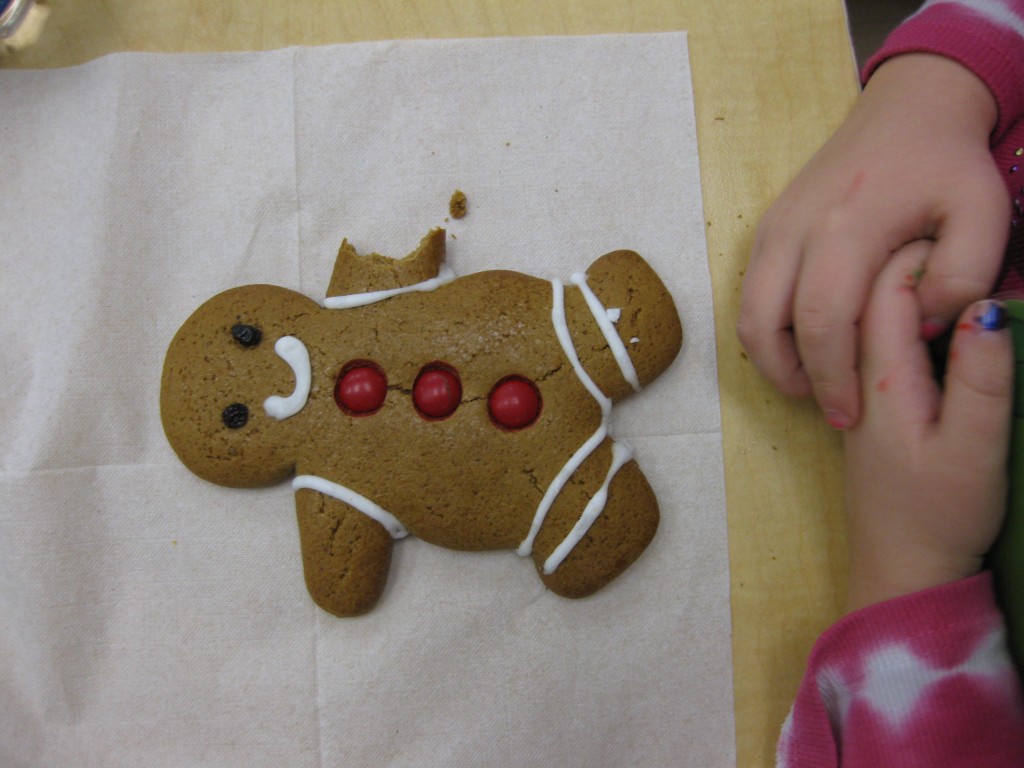
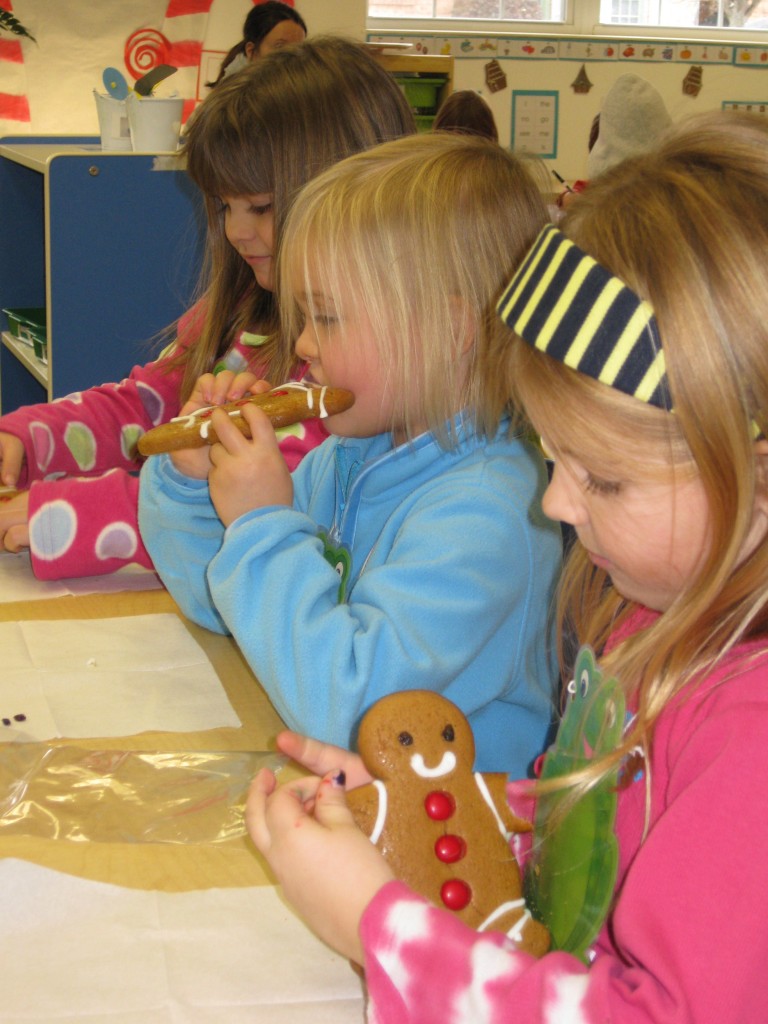
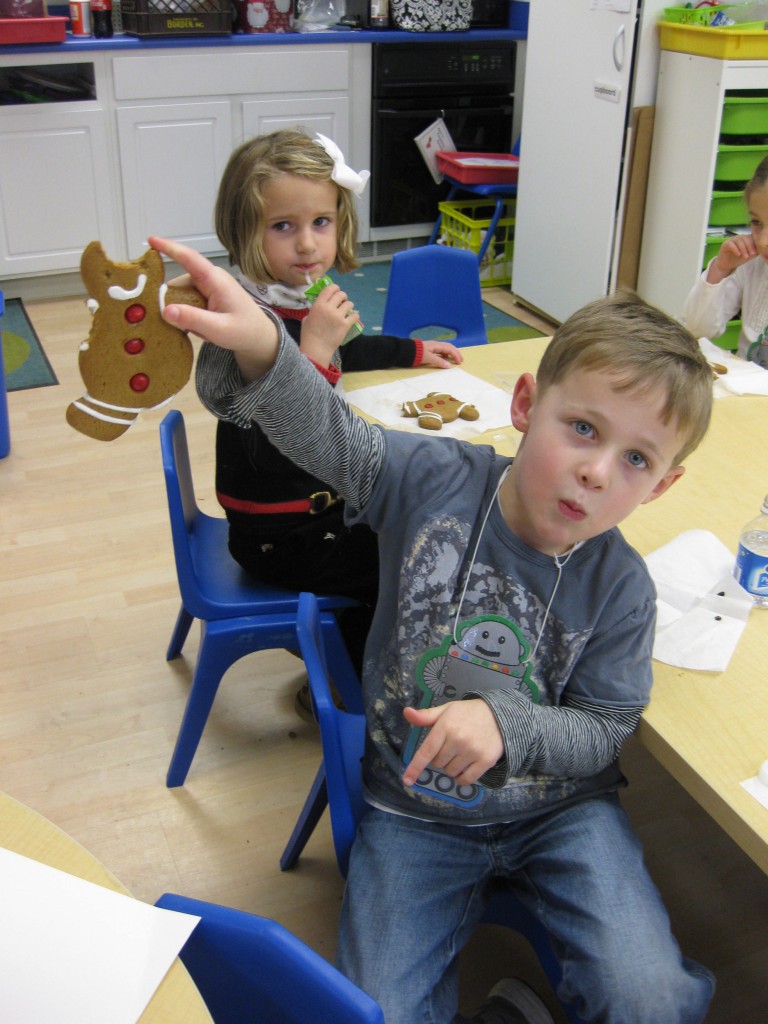
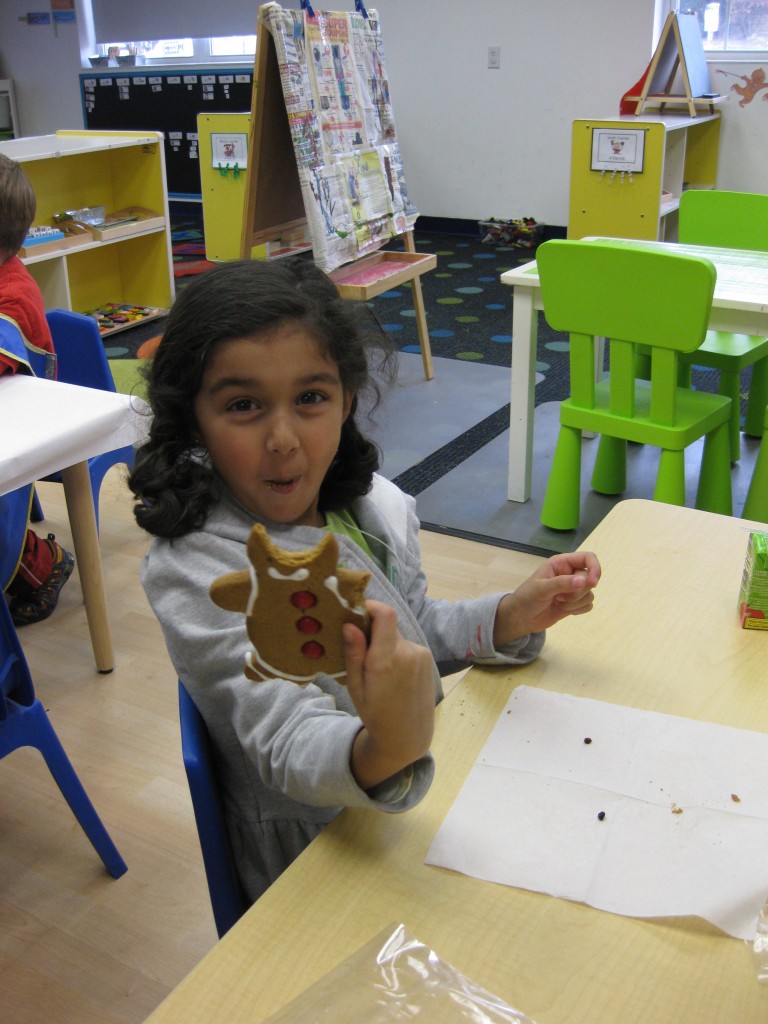
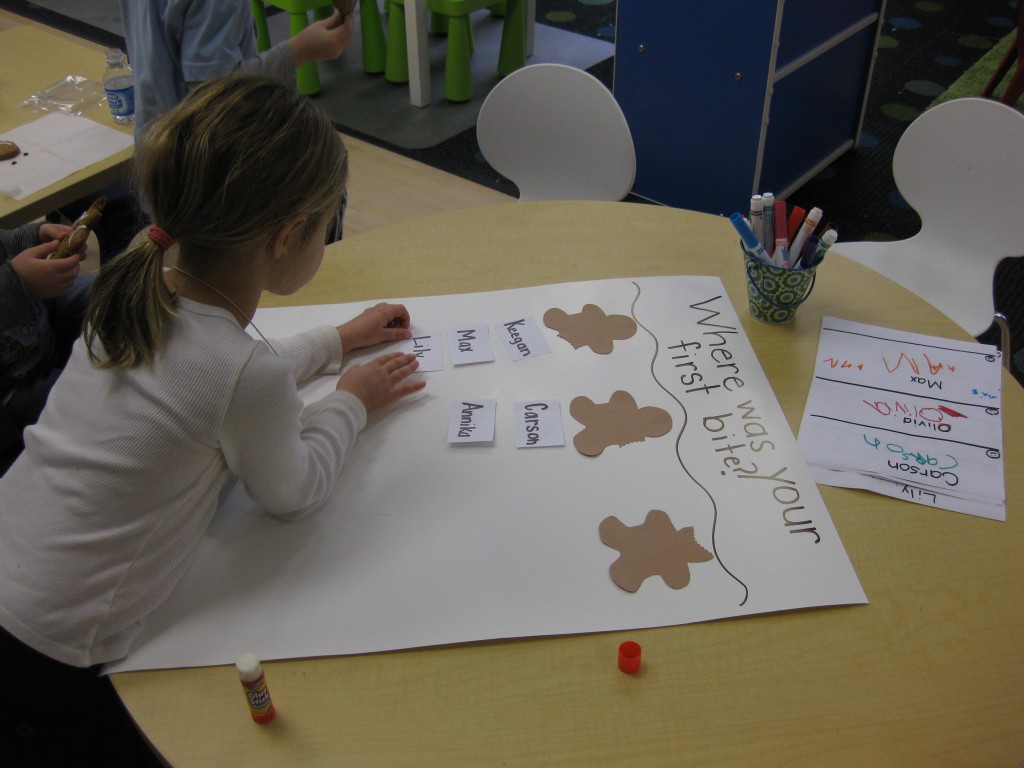
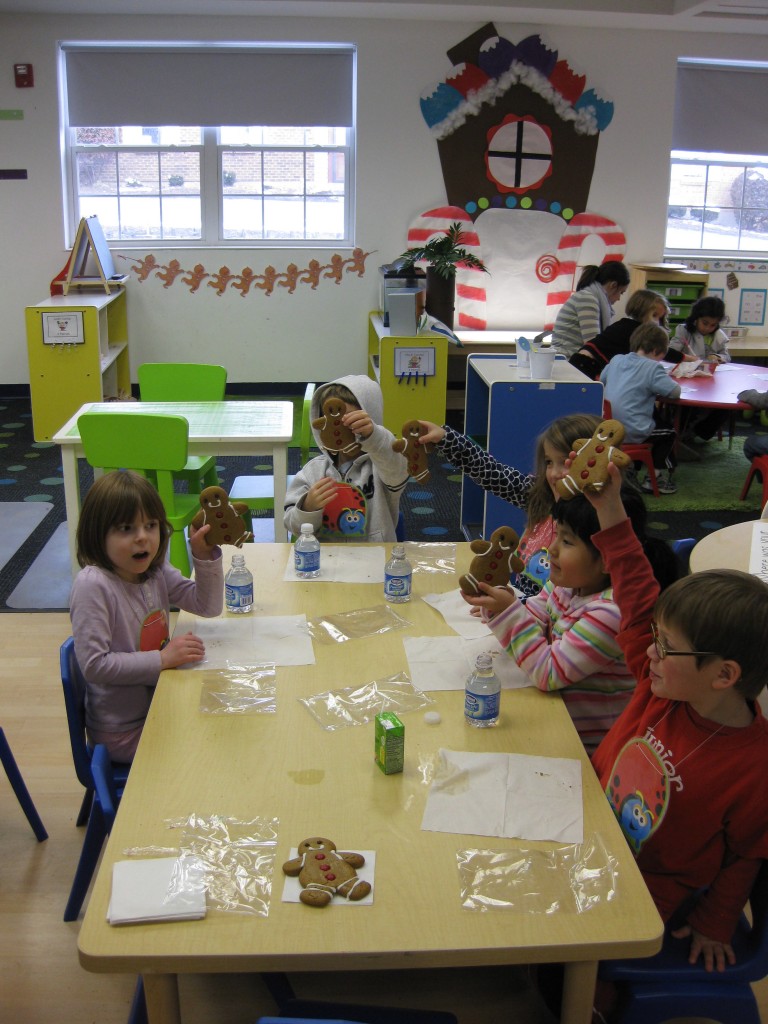
We continued our math study in small groups through the creation of a Gingerbread Graph. We took one big bite of a delicious gingergread cookie and recorded where we took our first bite on a class graph. We then compared each column by identifying which location had the most names and the least names. Looks like the leg was the winner!
