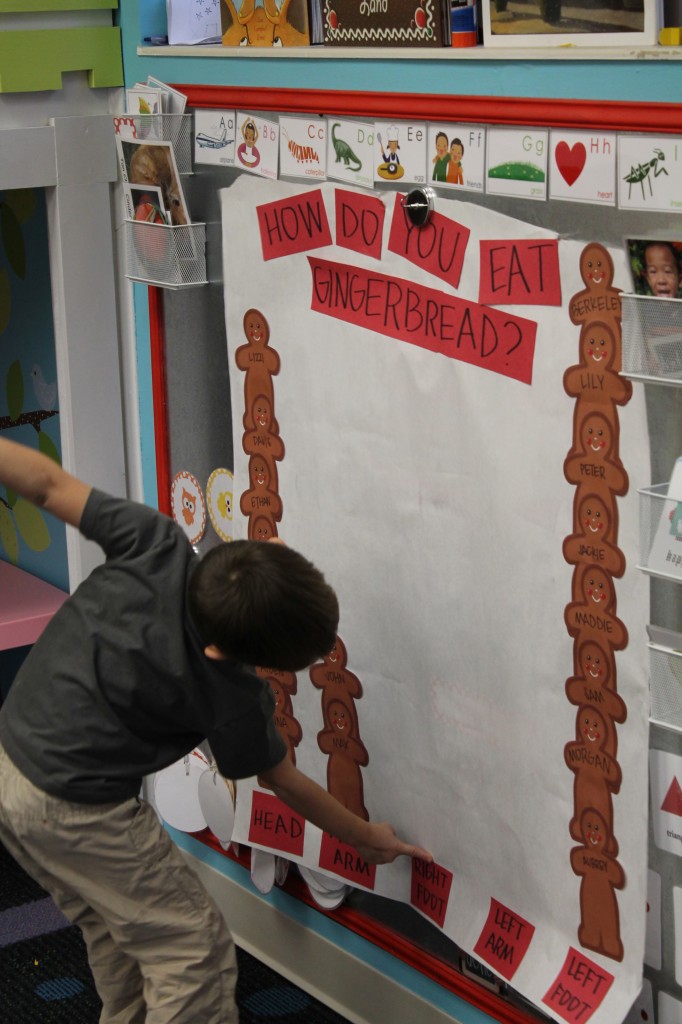
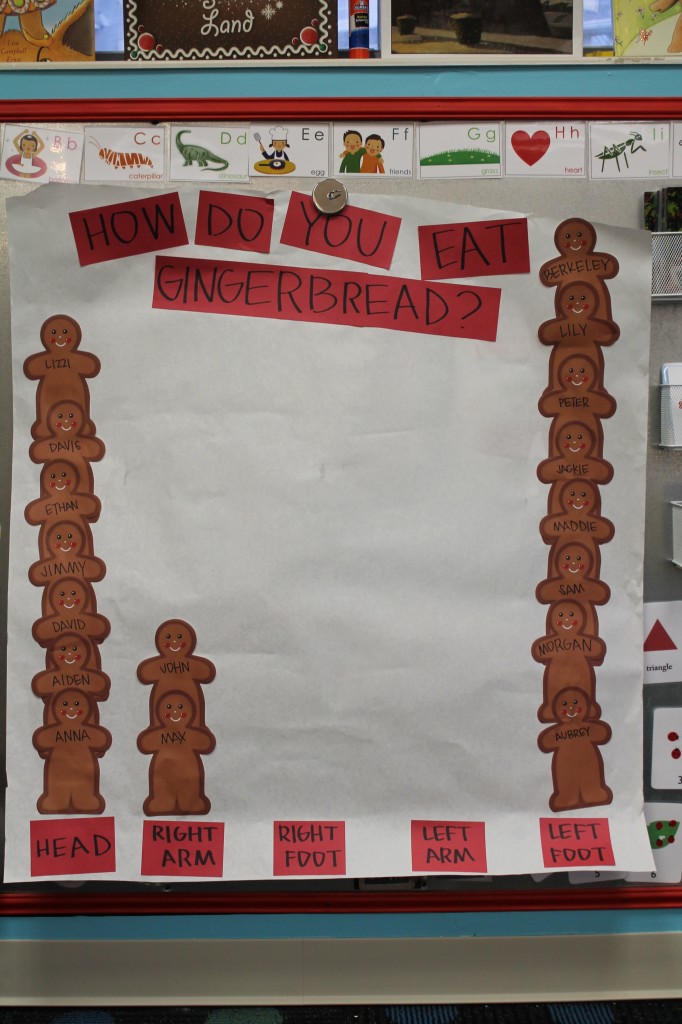
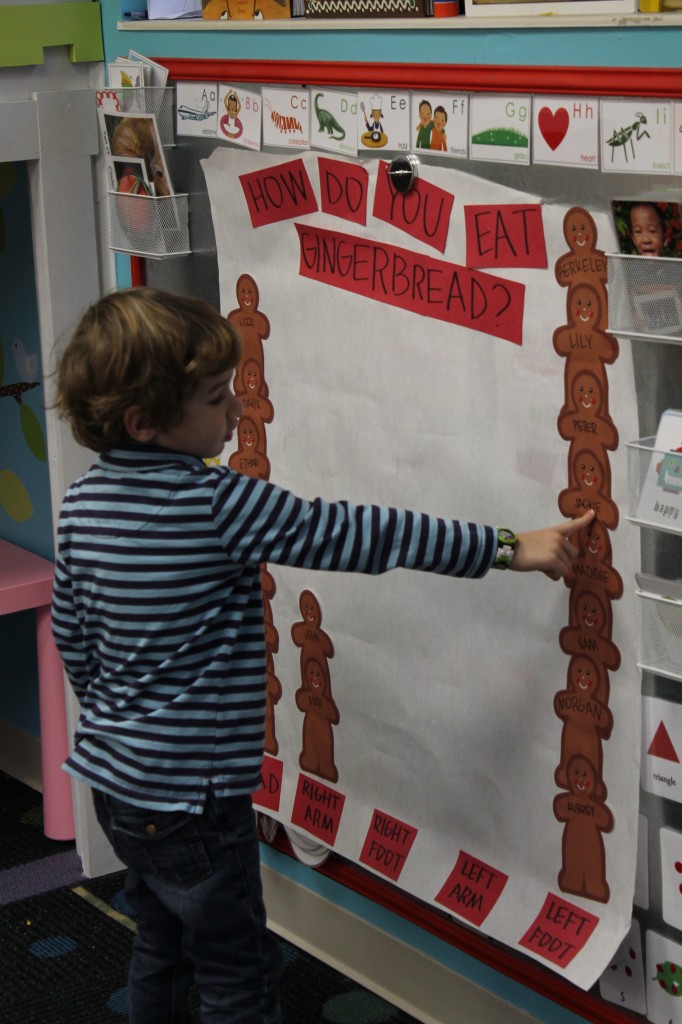
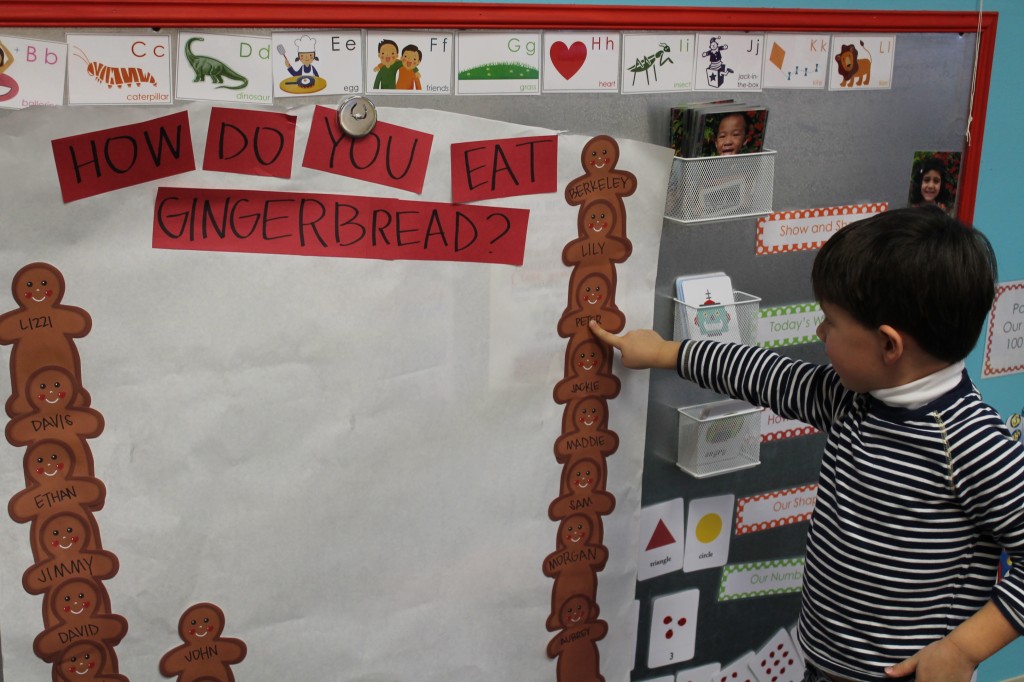
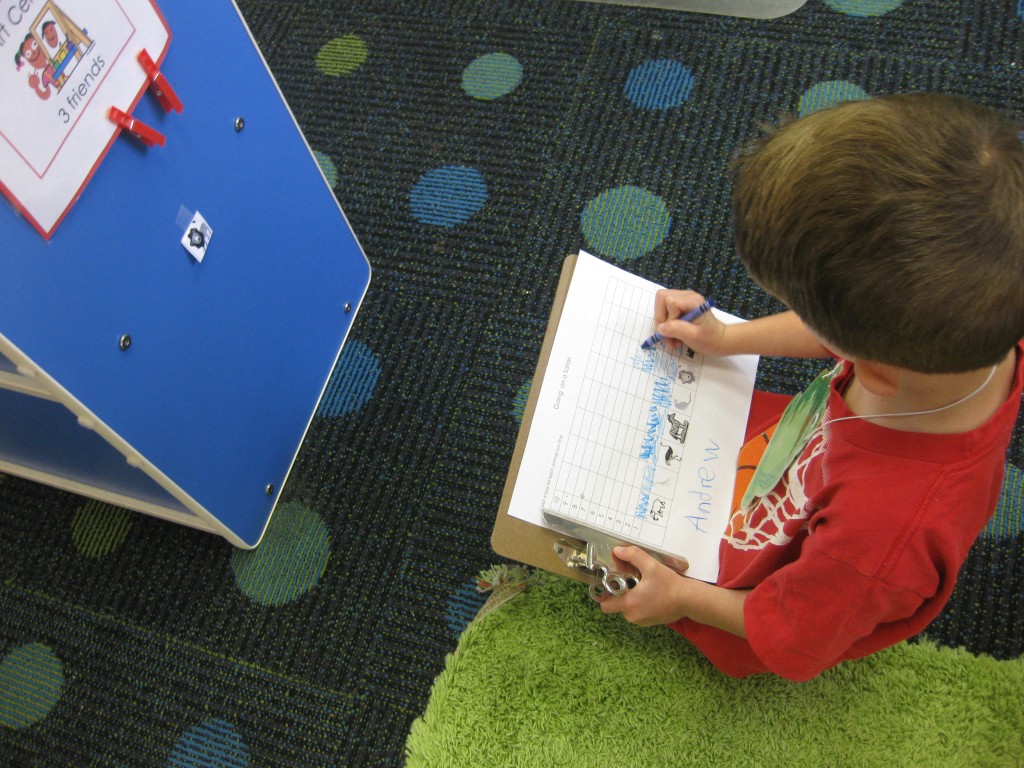
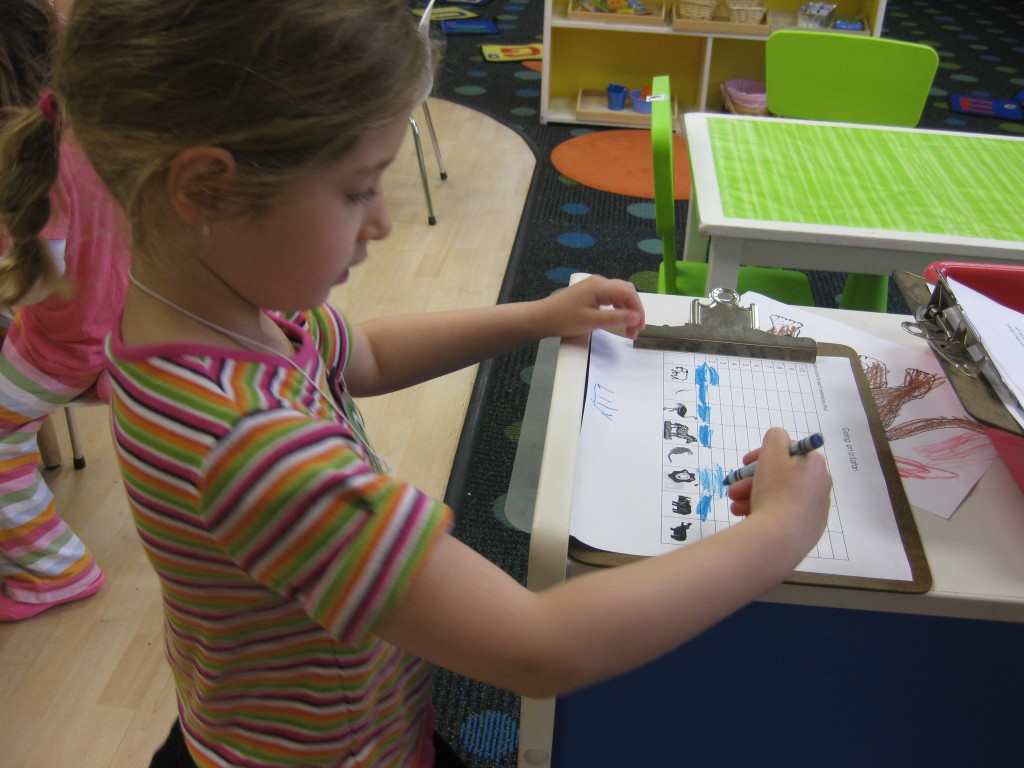
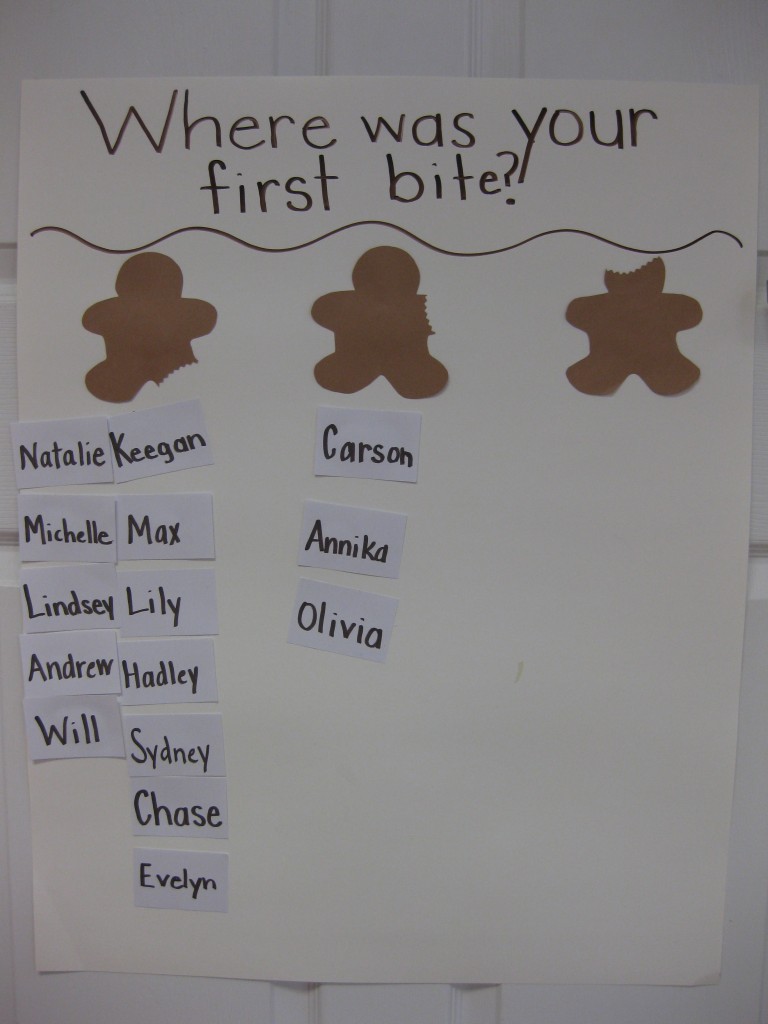
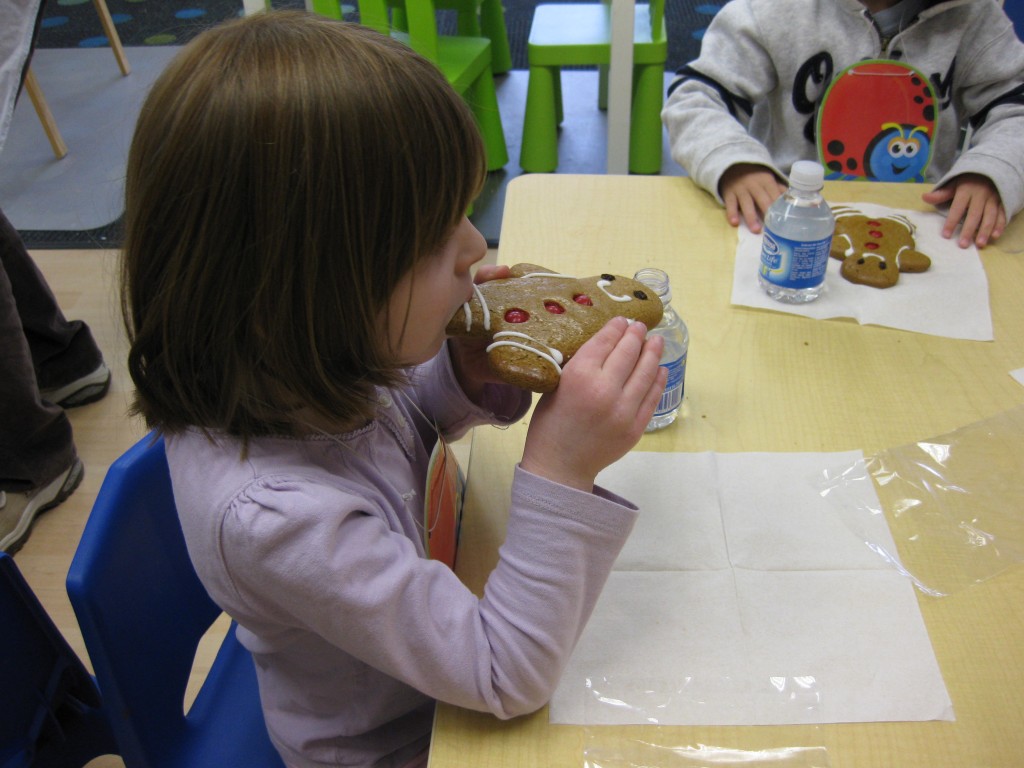
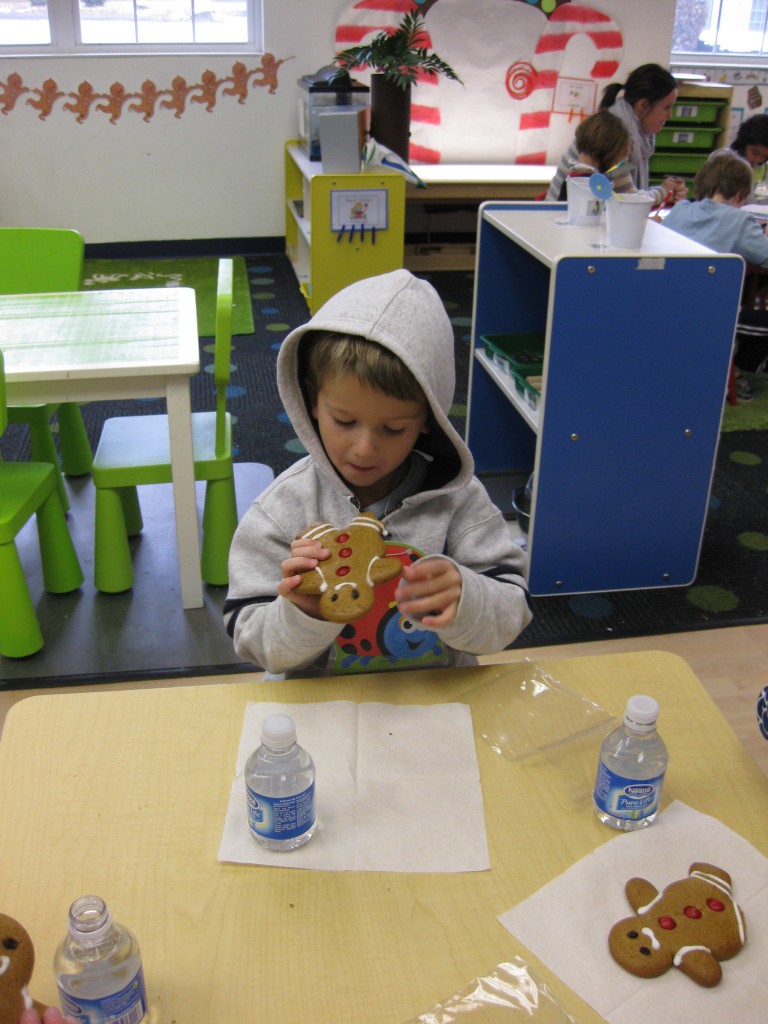
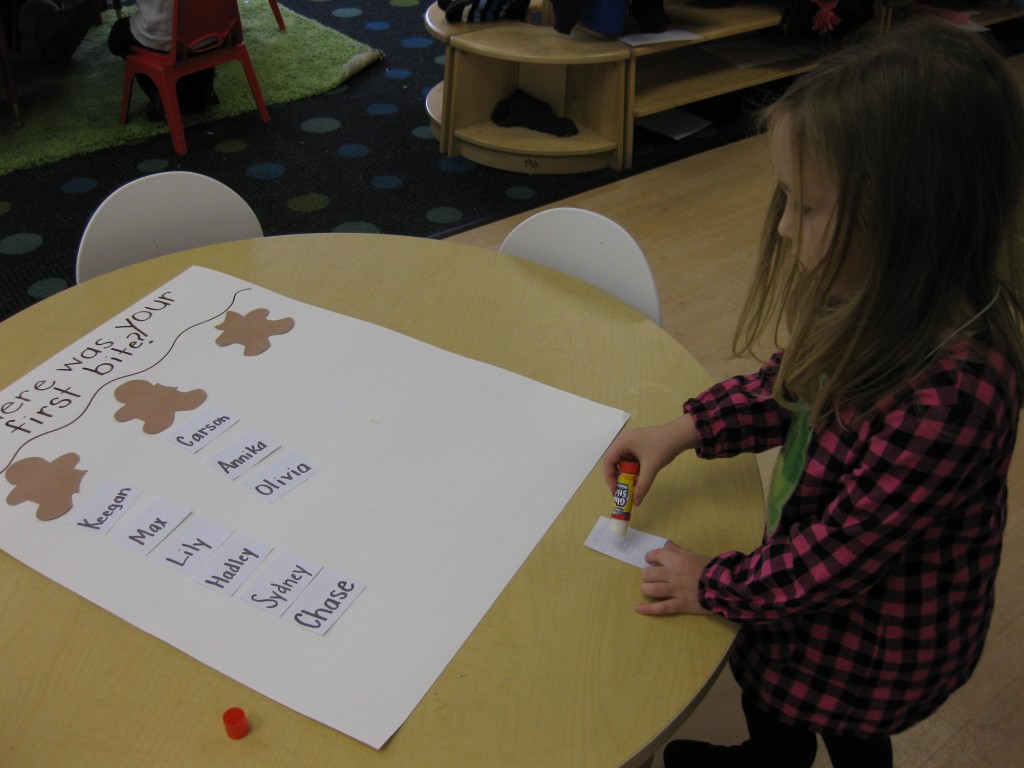
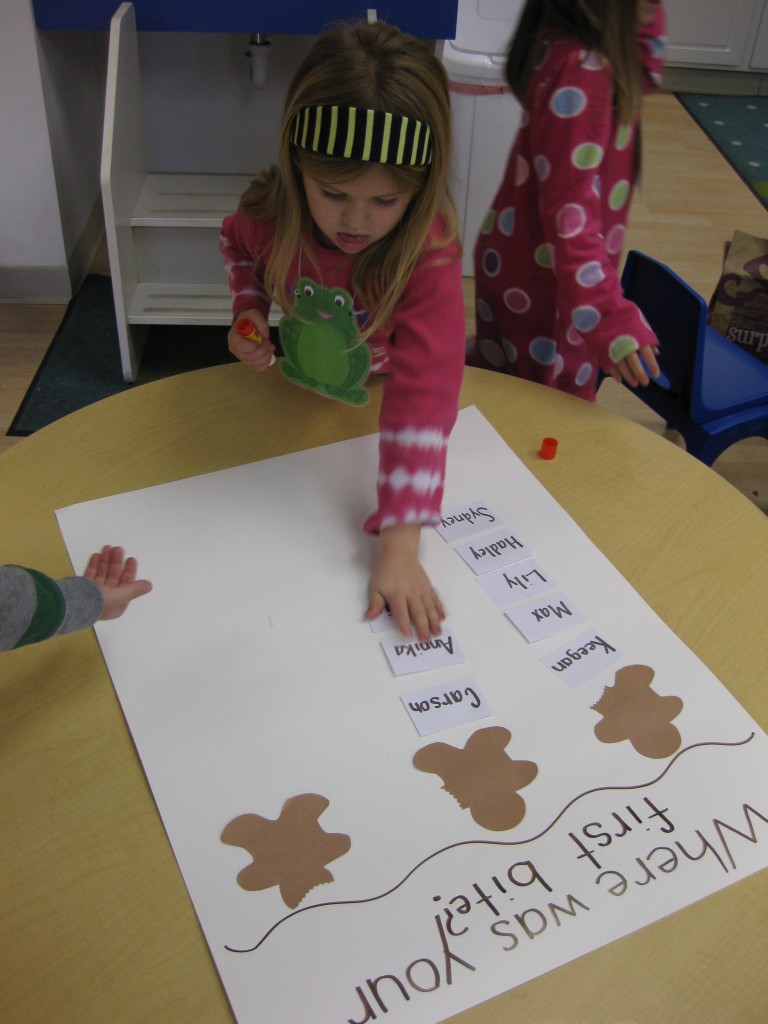
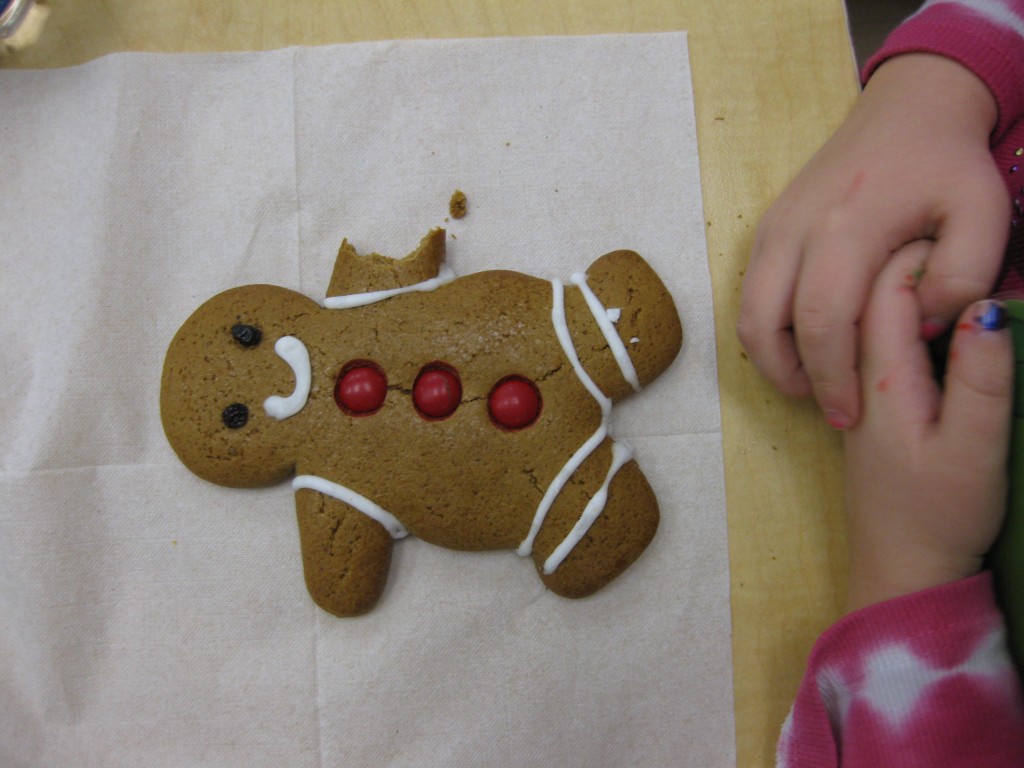
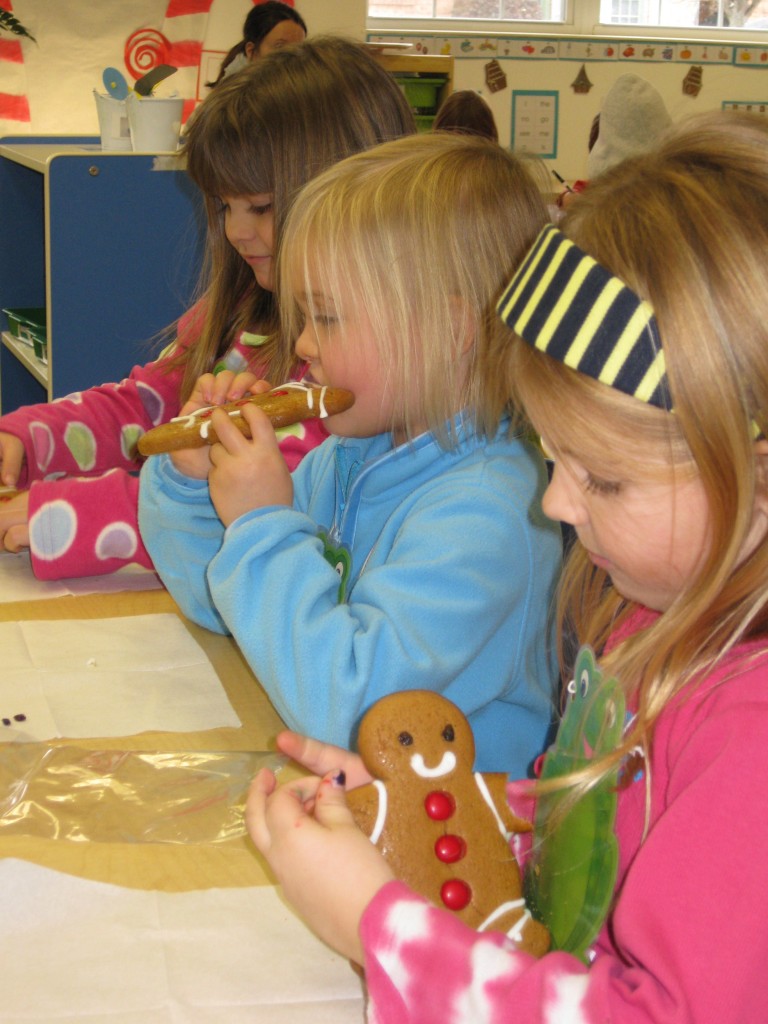
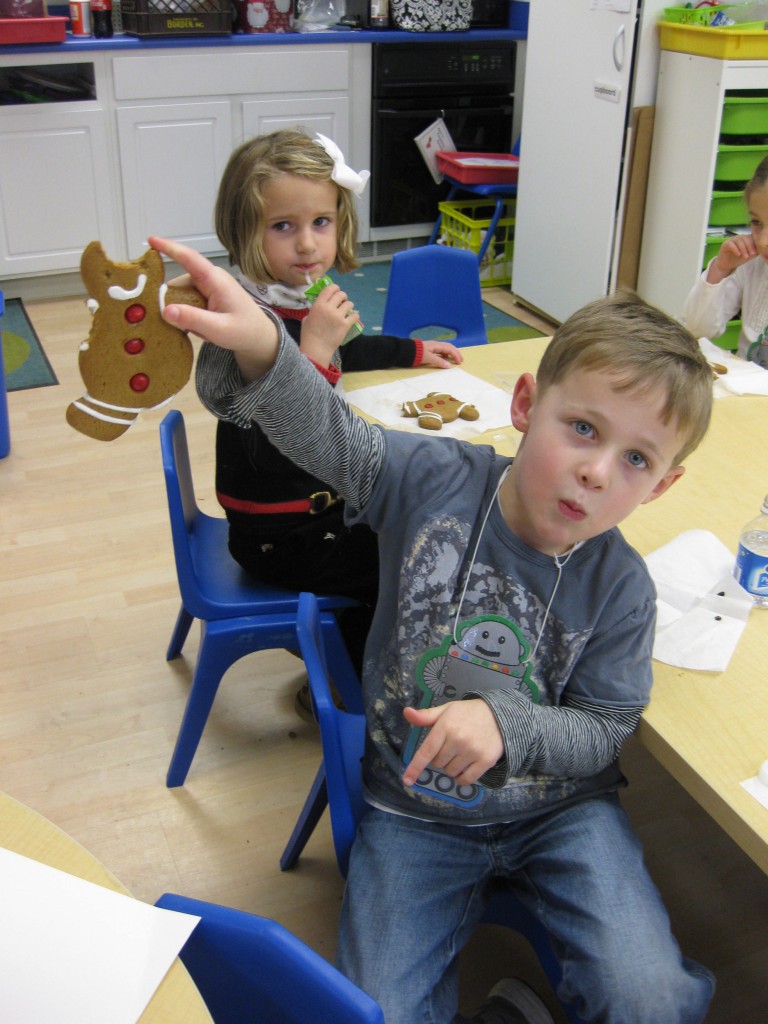
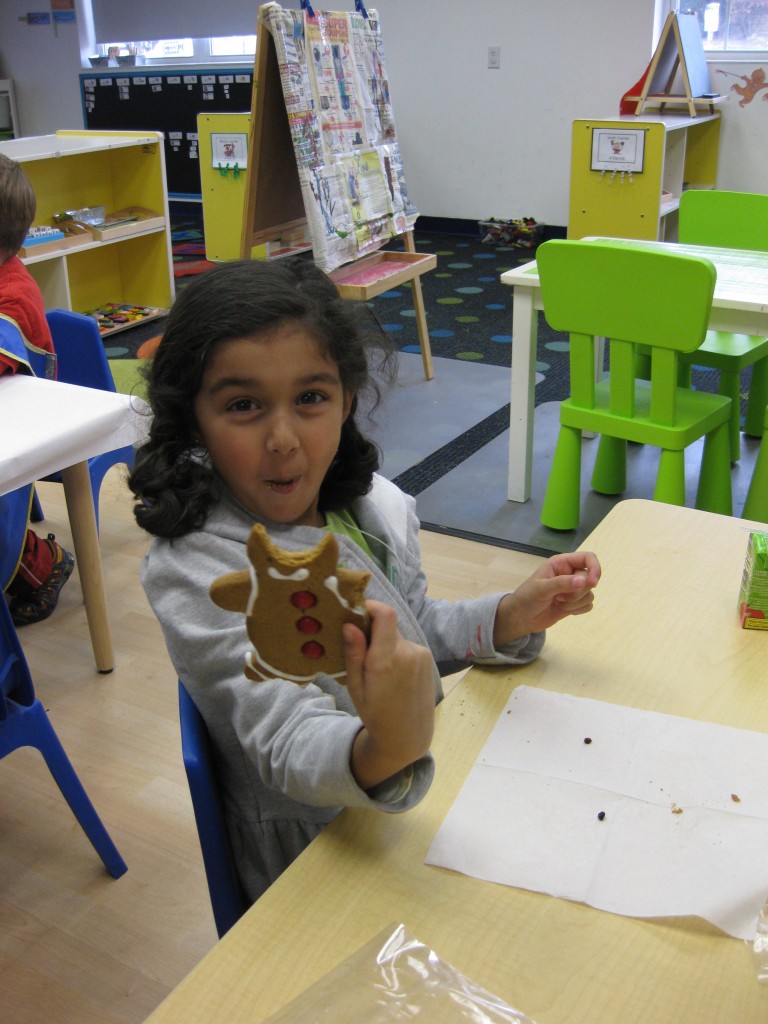
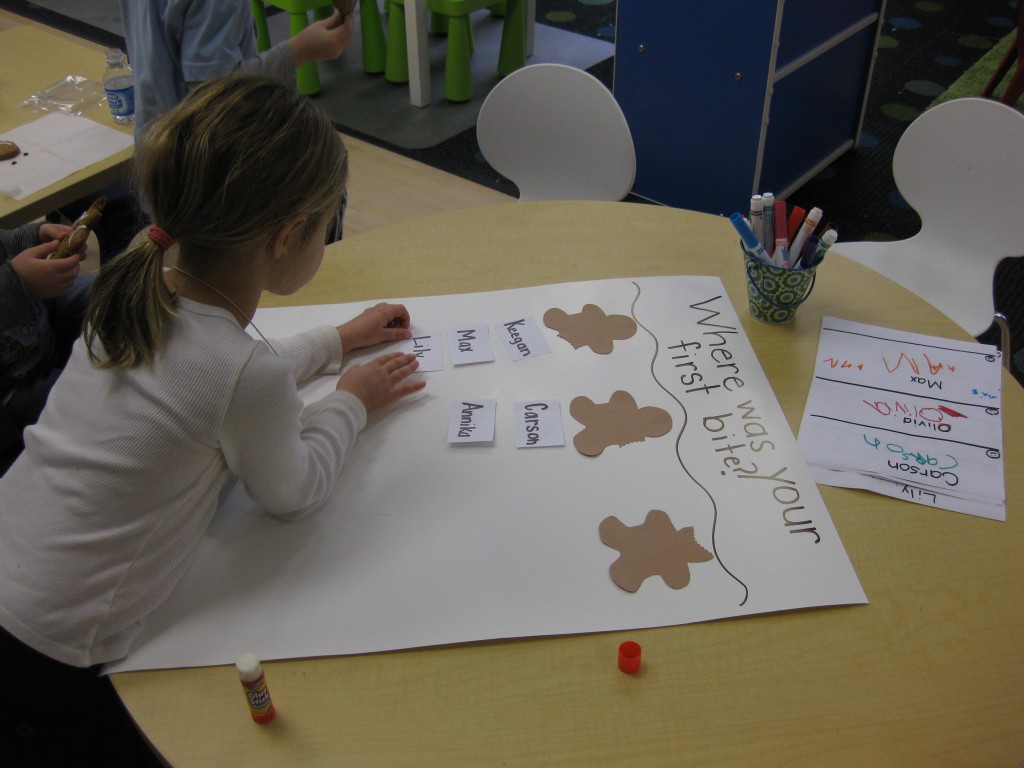
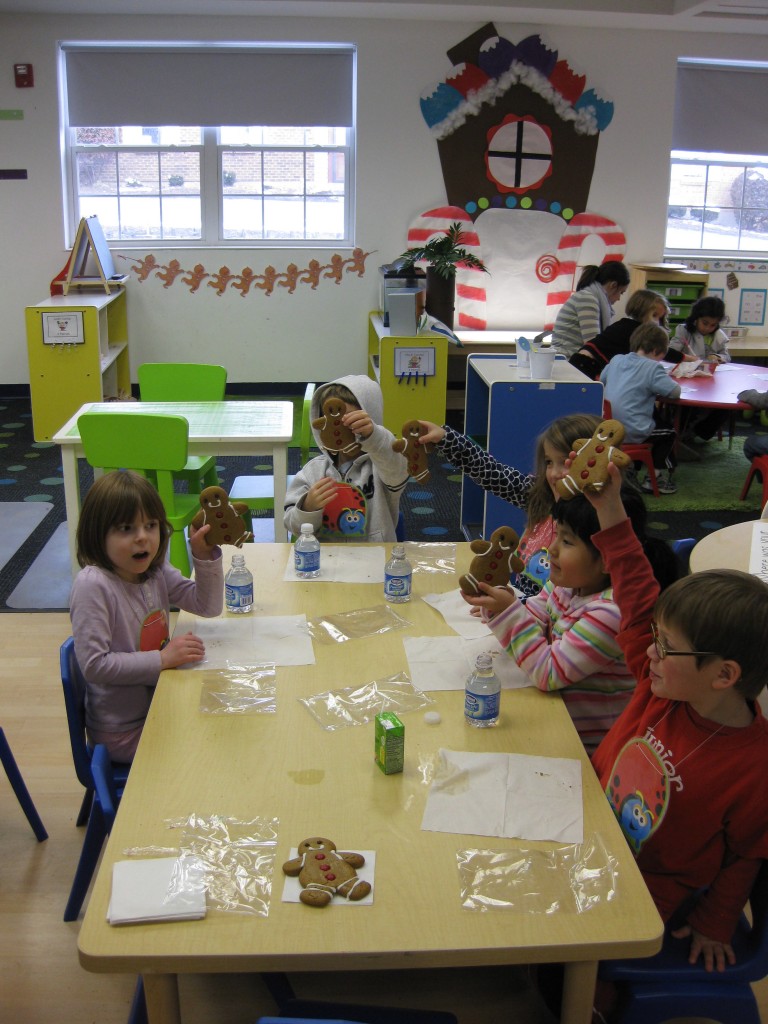
How do YOU eat a Gingerbread man? Where would your first bite be for this delicious holiday treat? After decorating our very own gingerbread pirates we took our first bite and recorded it on a pictograph.
How do YOU eat a Gingerbread man? Where would your first bite be for this delicious holiday treat? After decorating our very own gingerbread pirates we took our first bite and recorded it on a pictograph.
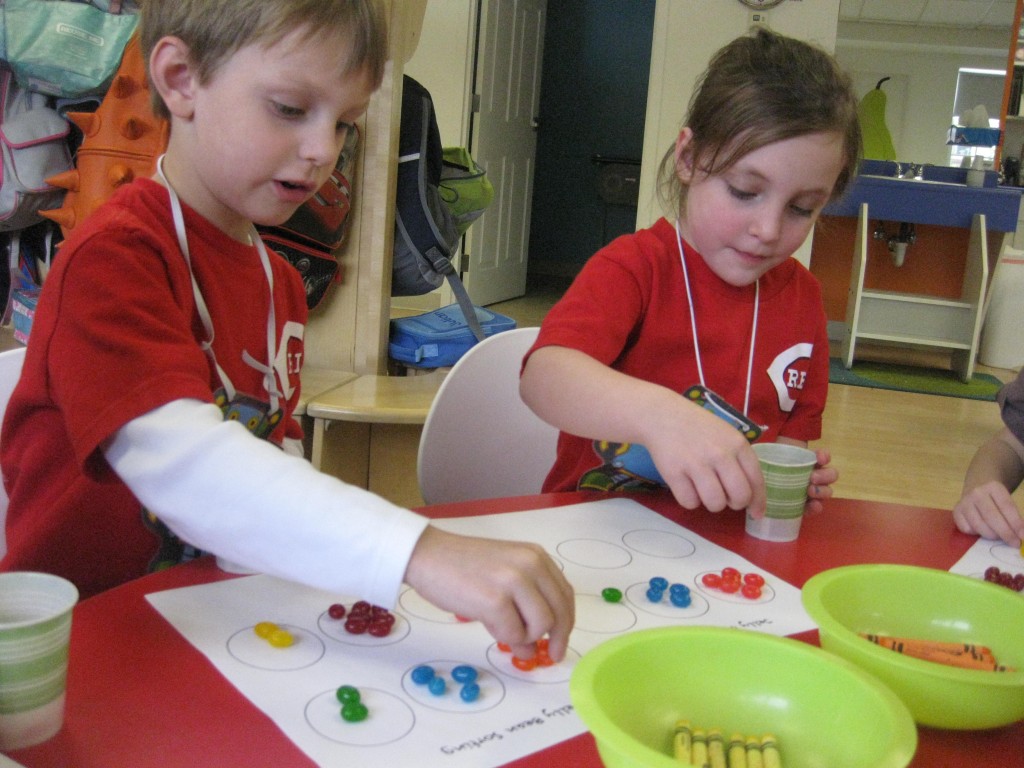
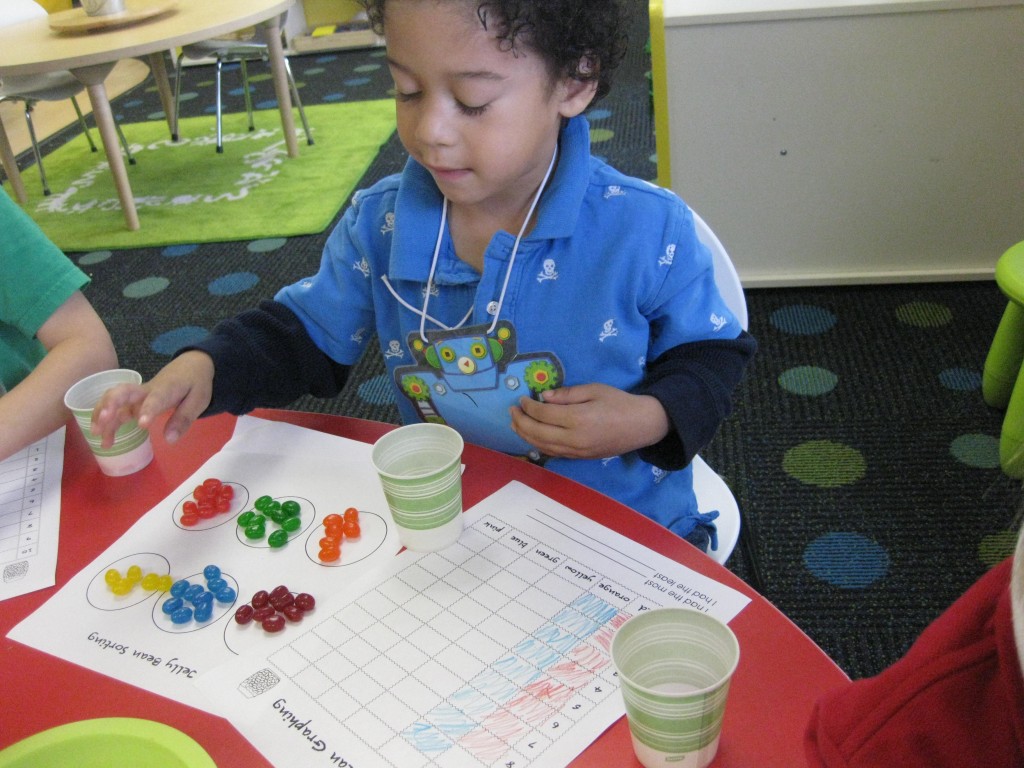
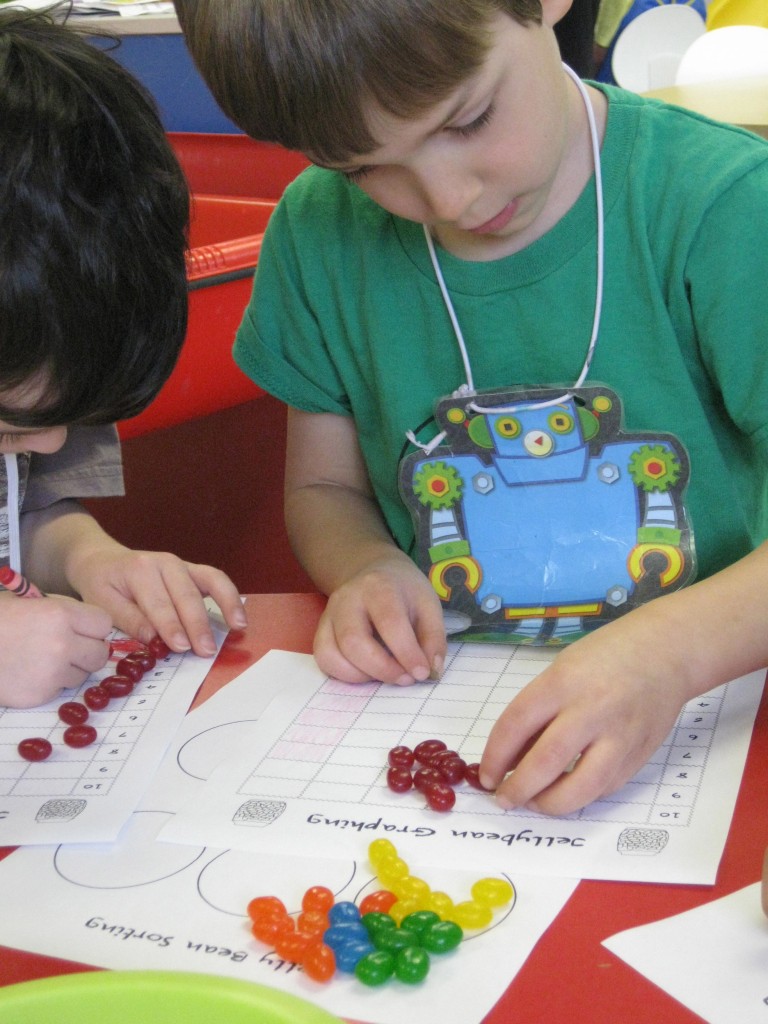
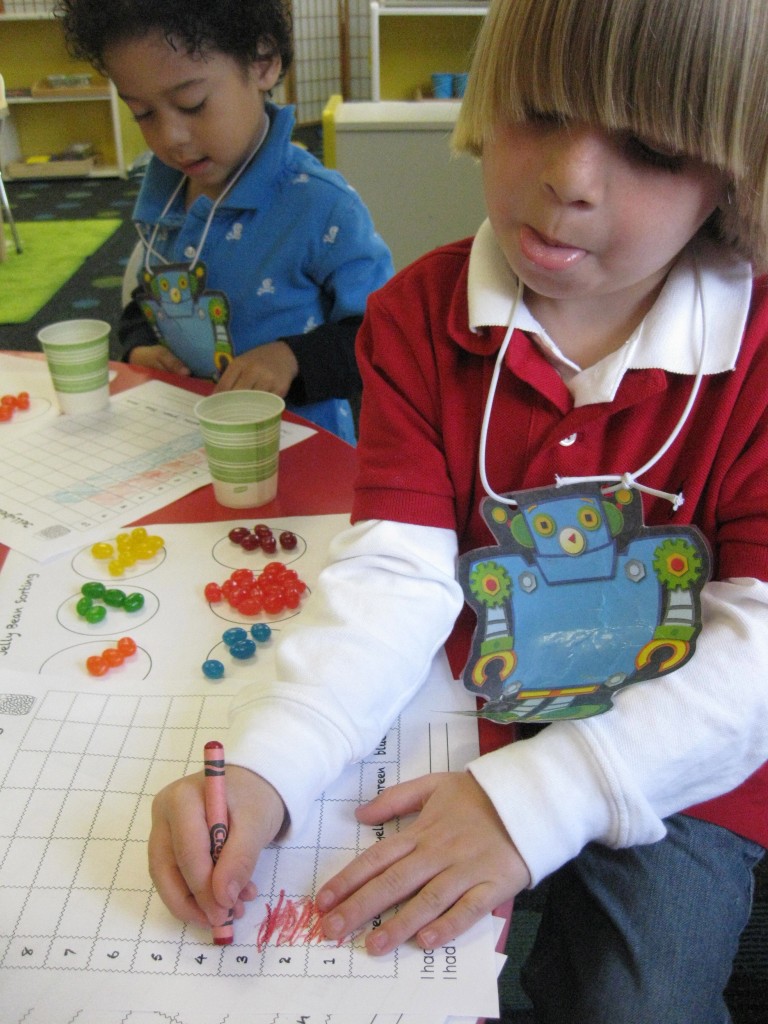
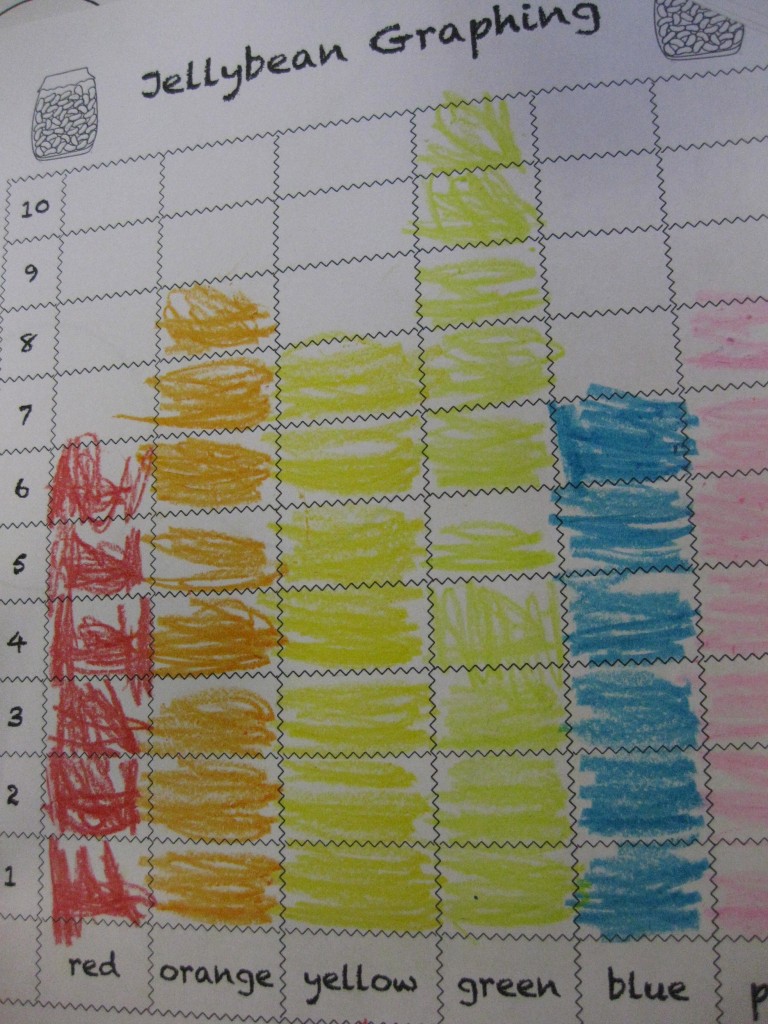
Sorting, graphing, counting, and comparing quantities of sets were all involved in our Jelly Bean Math Activity!
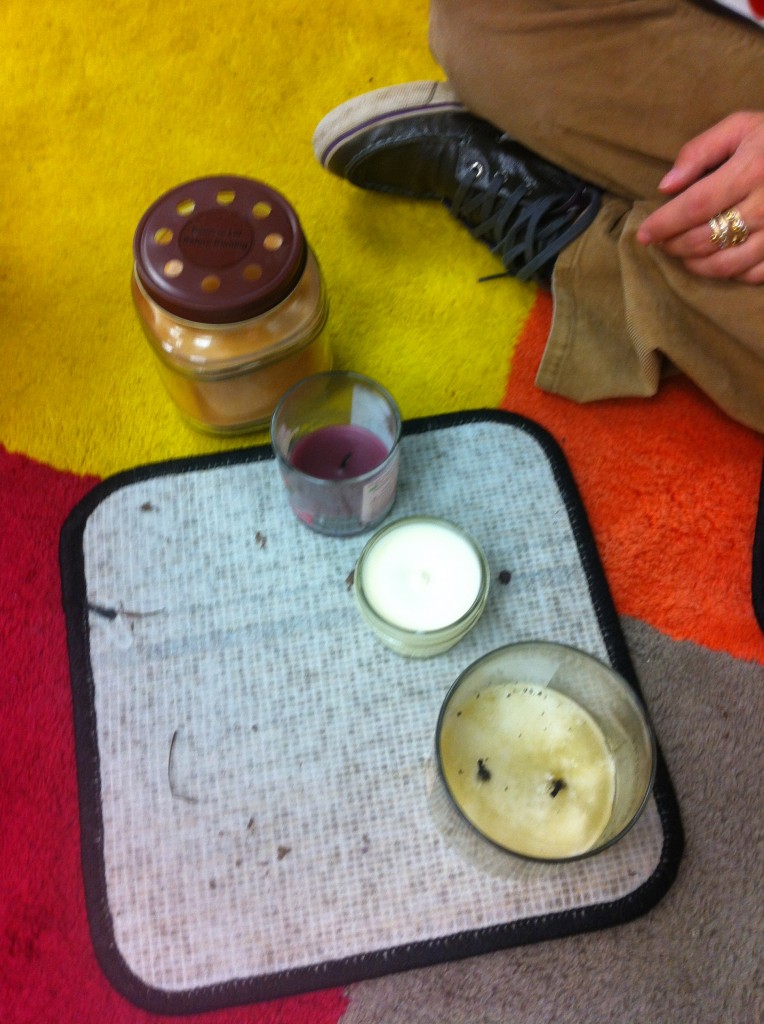
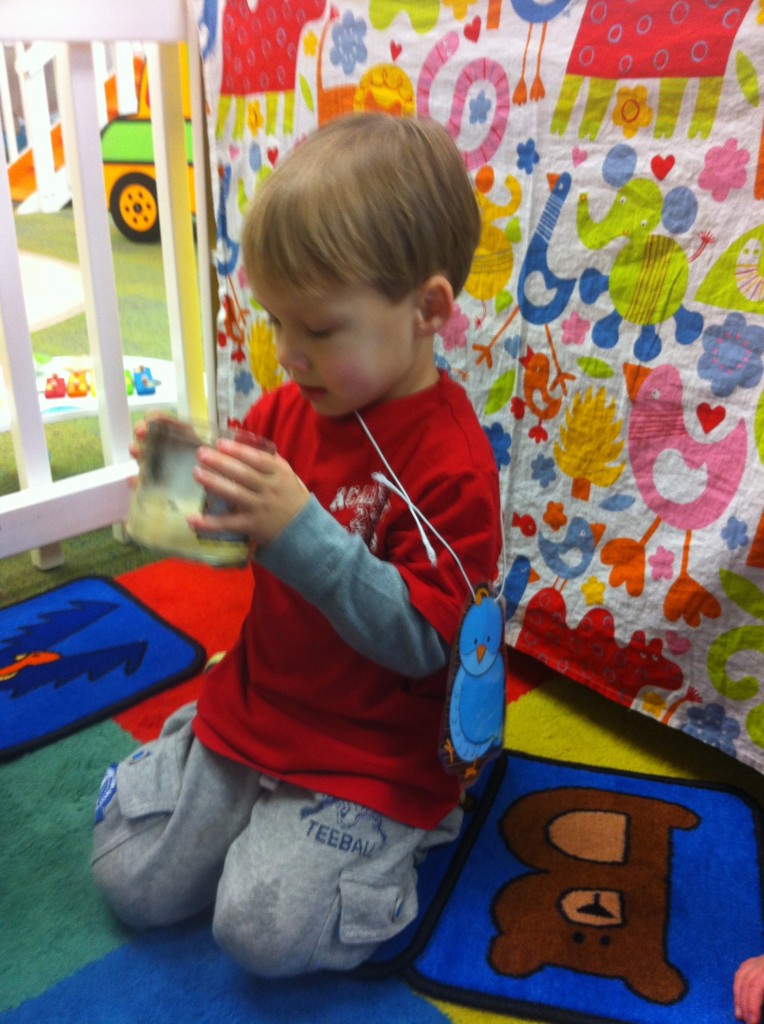
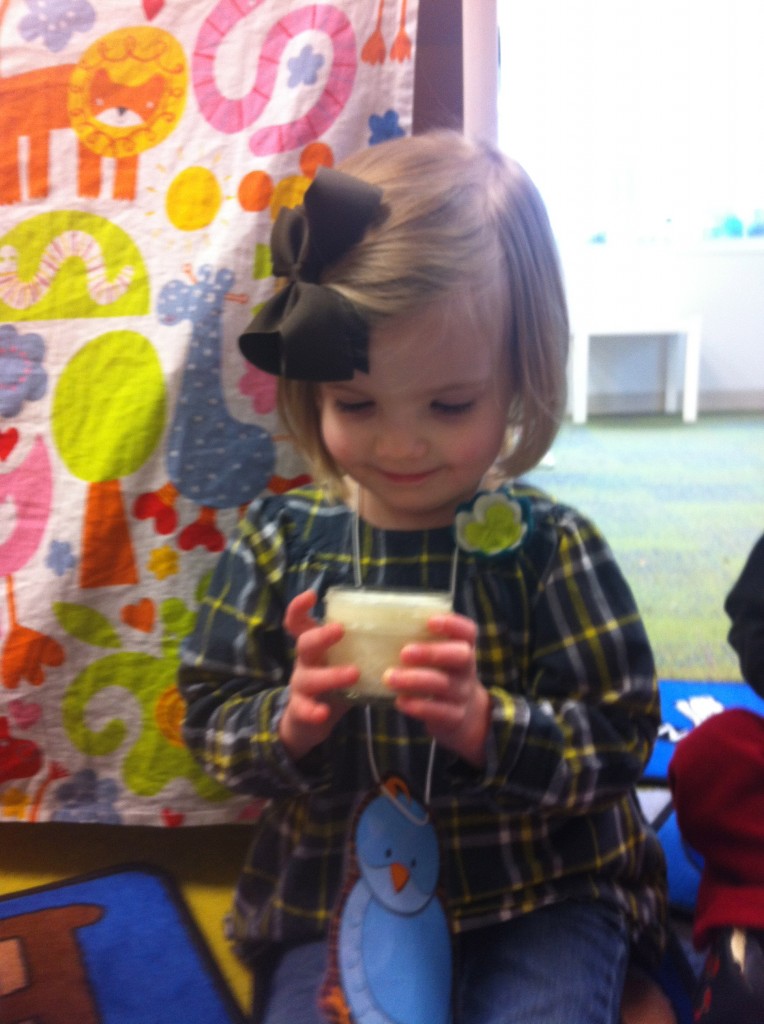
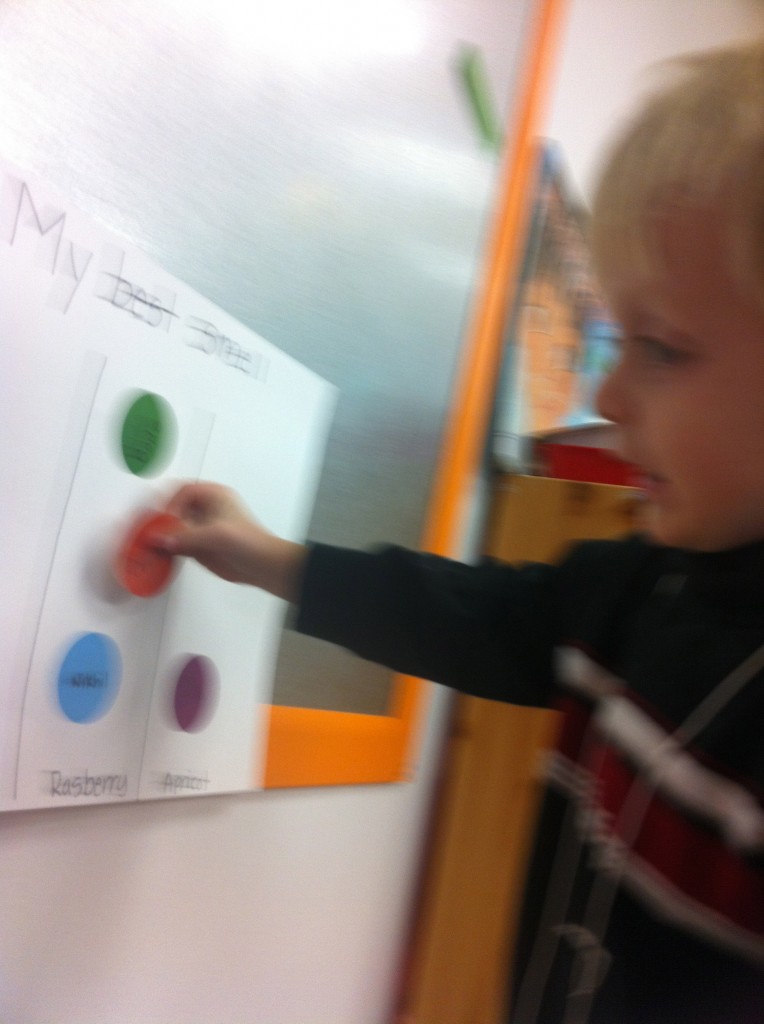
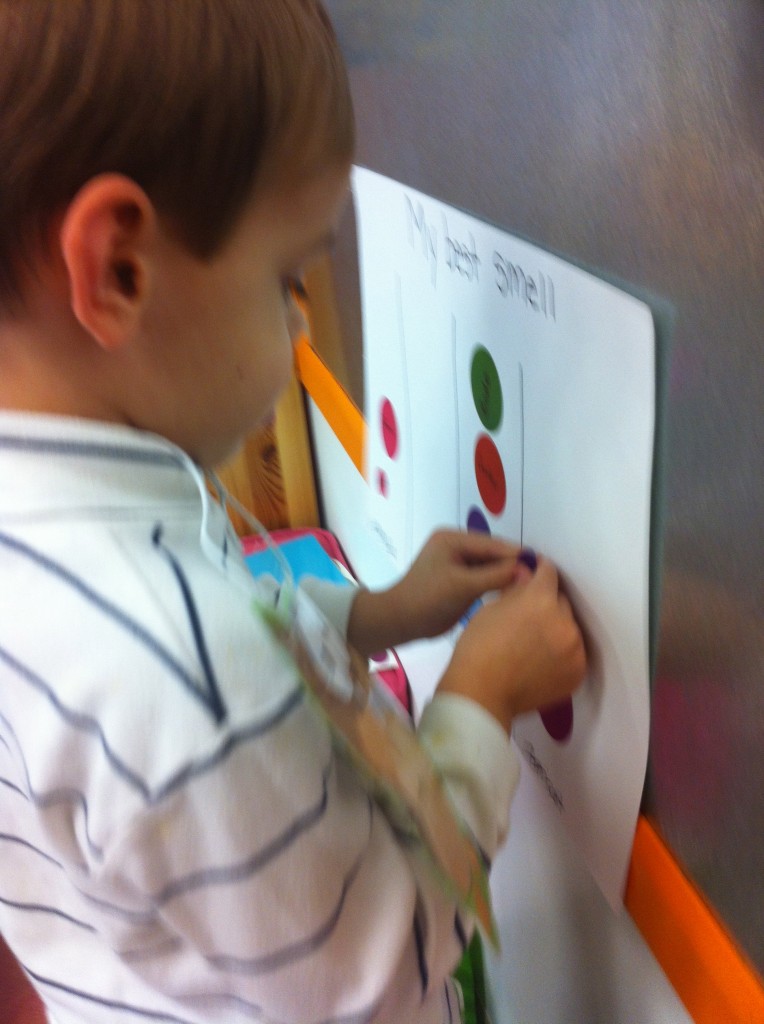
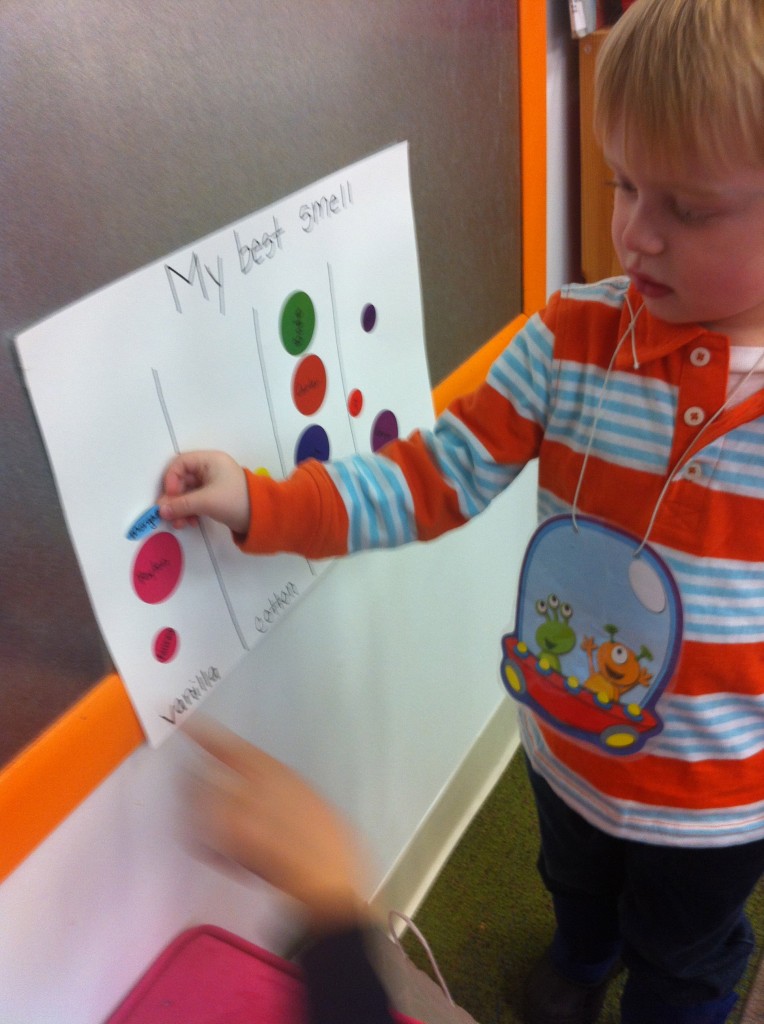
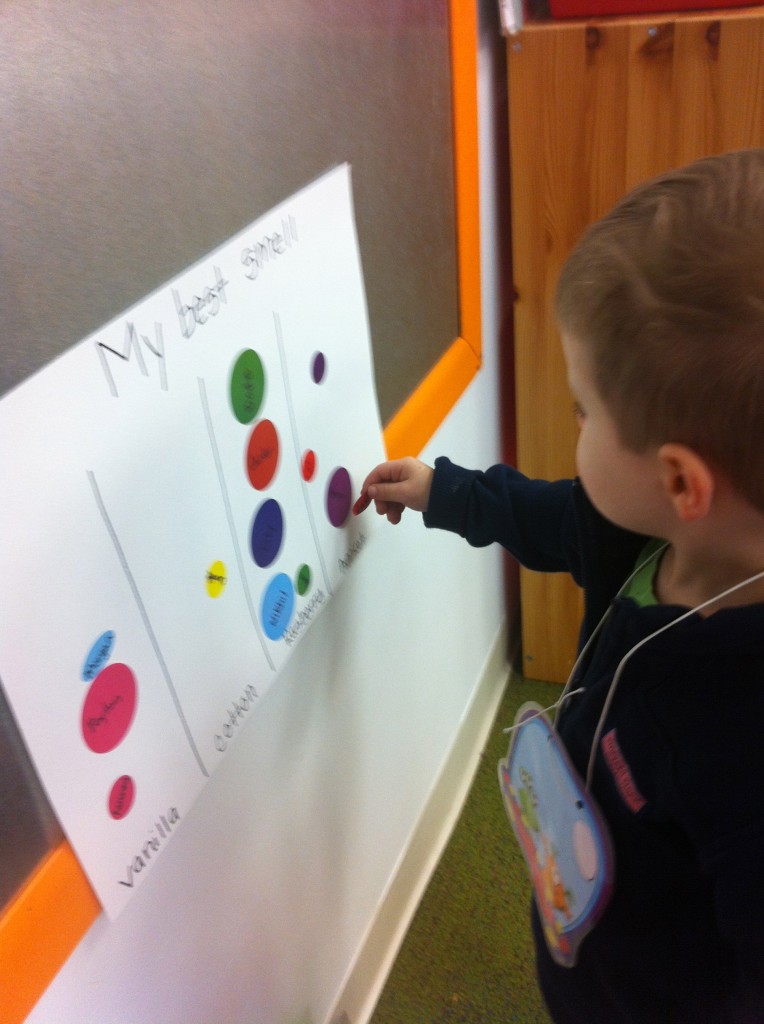
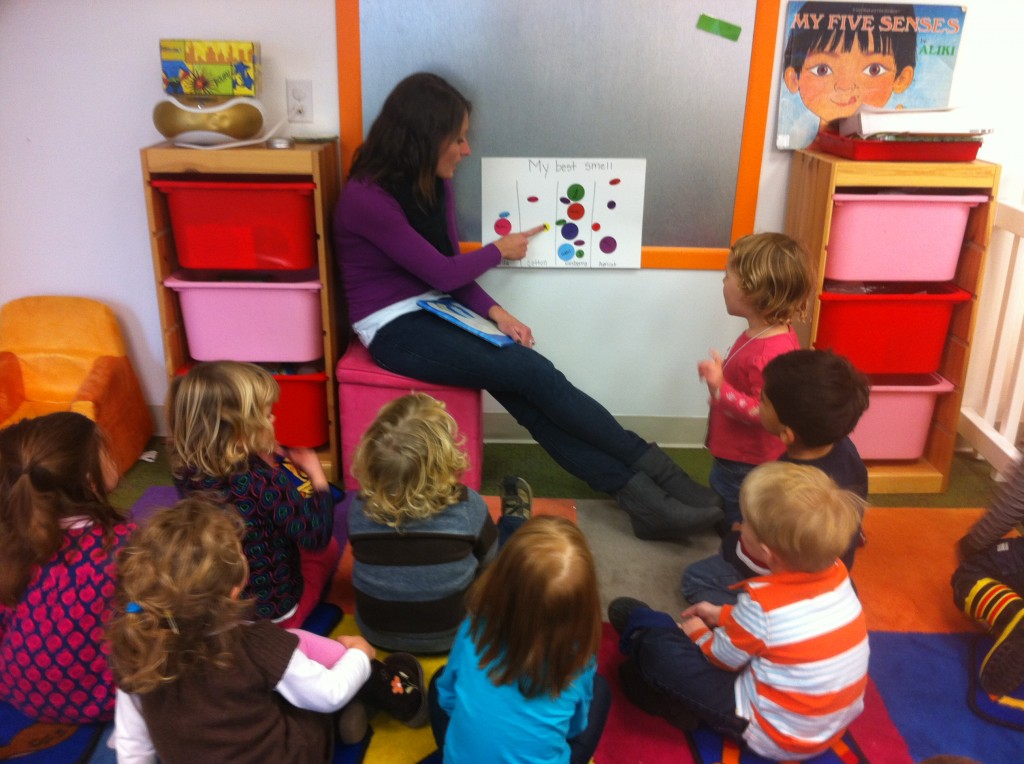
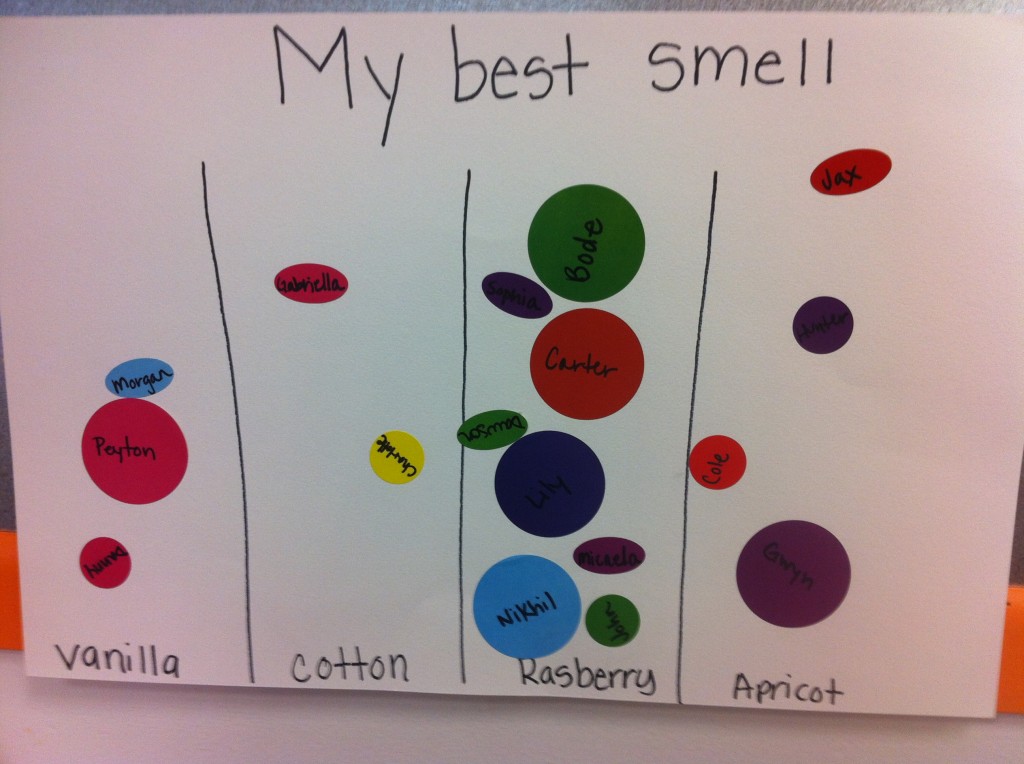
We talked about our sense of smell today in the Early 3’s. We used our noses to smell different candles and then graphed which ones were our favorite. When we were done we counted how many people liked each scent and which scent was the class favorite.
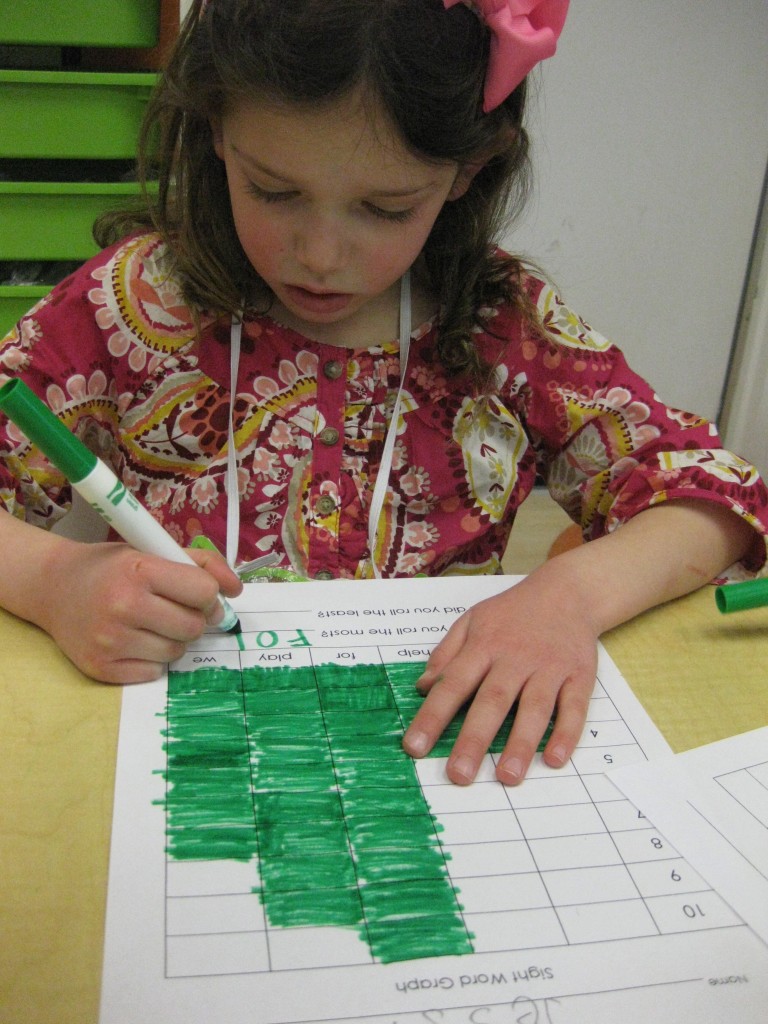
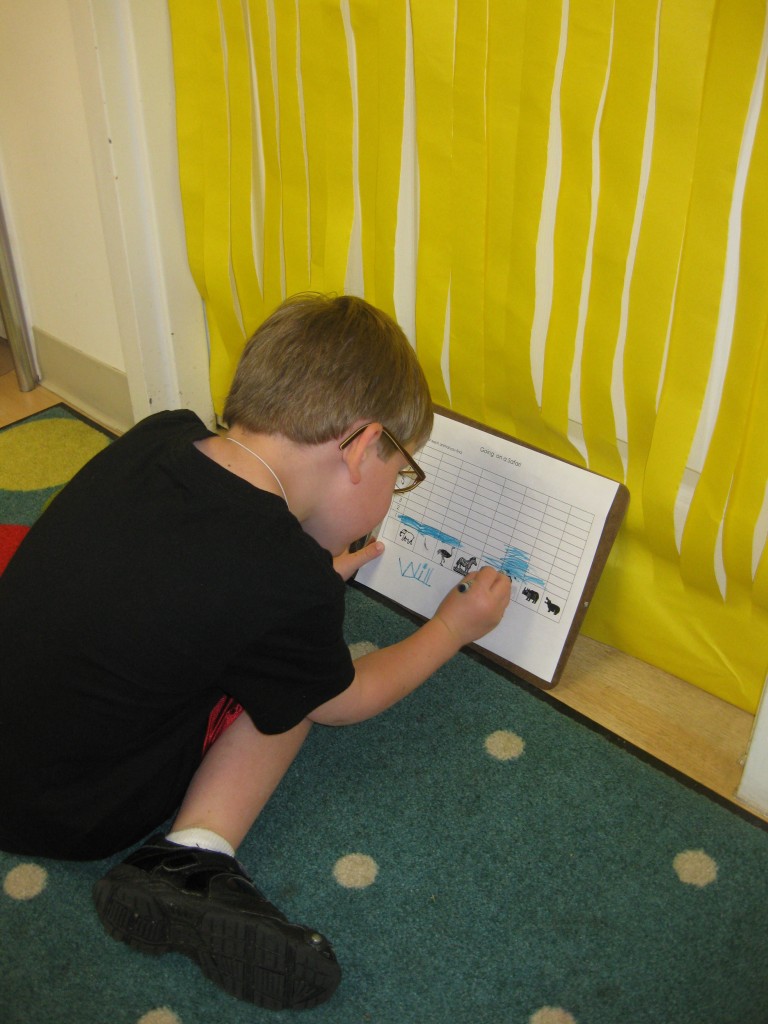
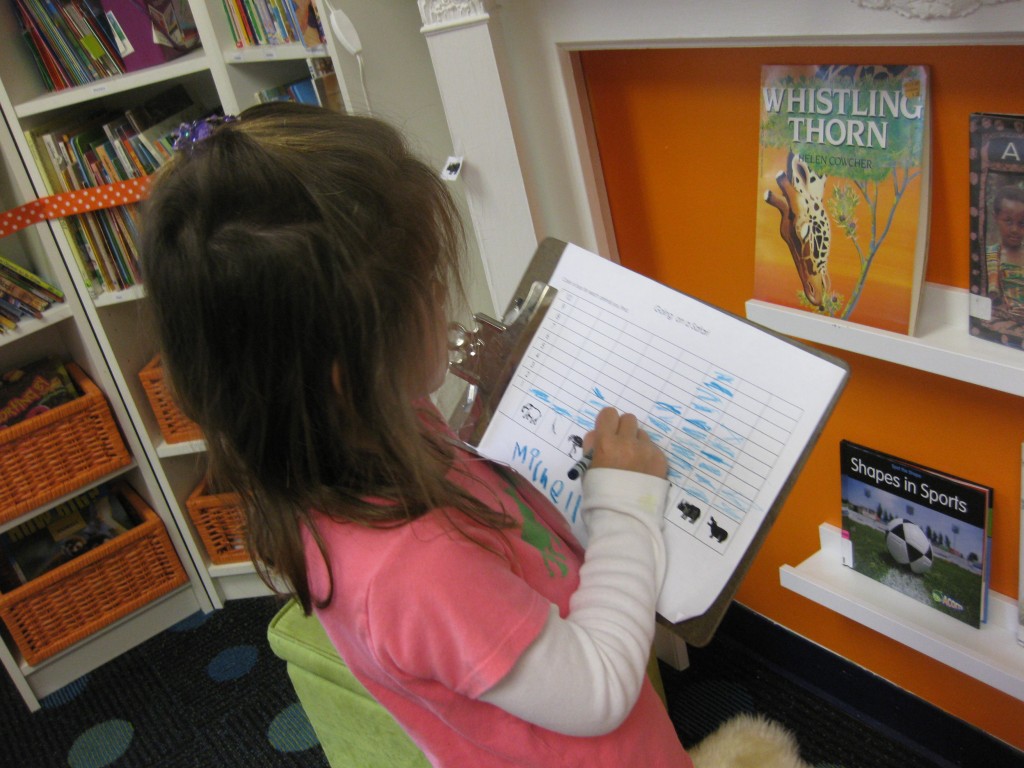
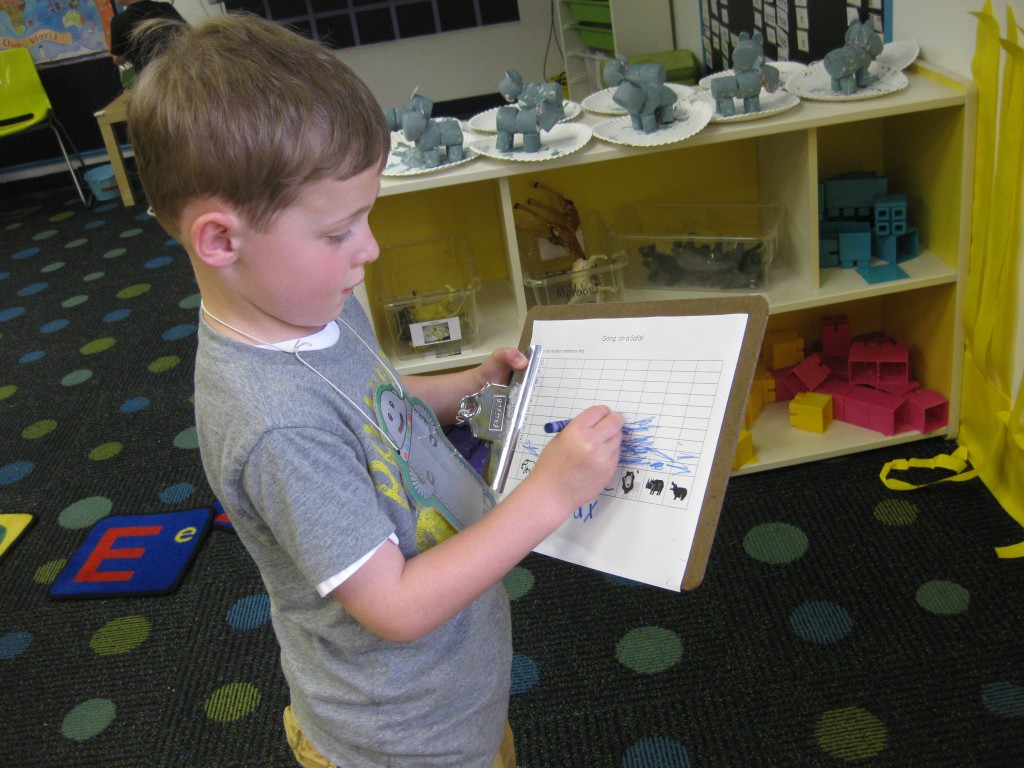
We went on an African safari during small groups and kept a record of the animals we found throughout the school. We used our graph to explore an important math concept for Kindergarten…comparing sets…which animal did we find the most of? Which animal did we find the least of? Did we find more giraffes or more lions? Did we find fewer zebras or fewer ostriches?
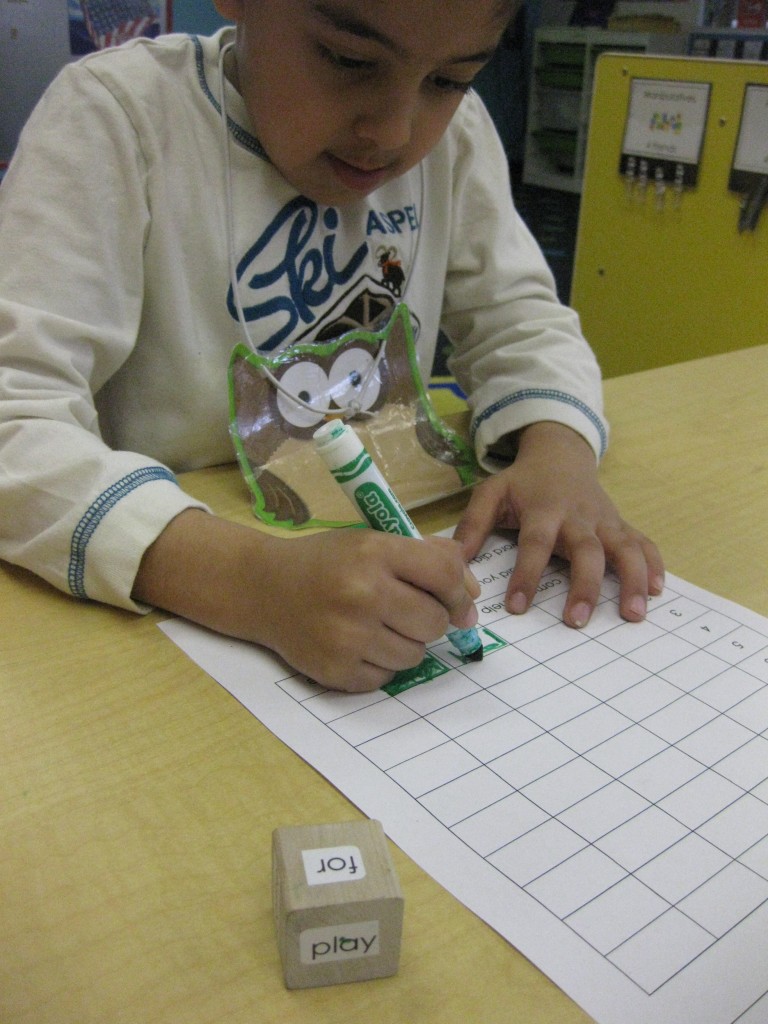
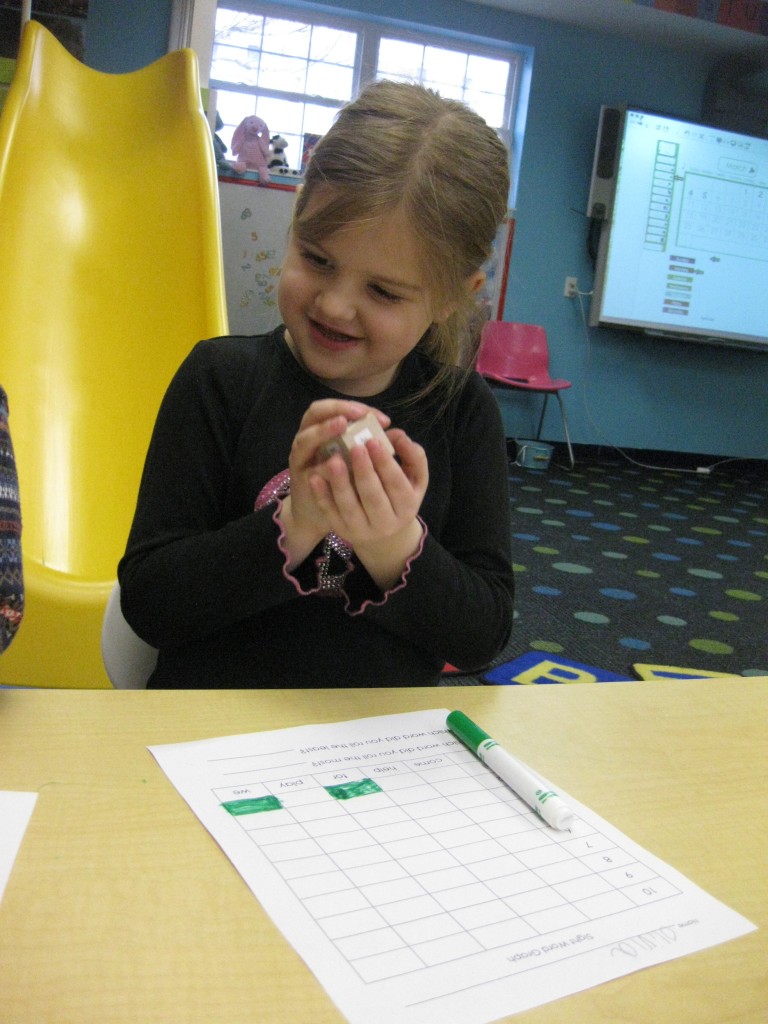
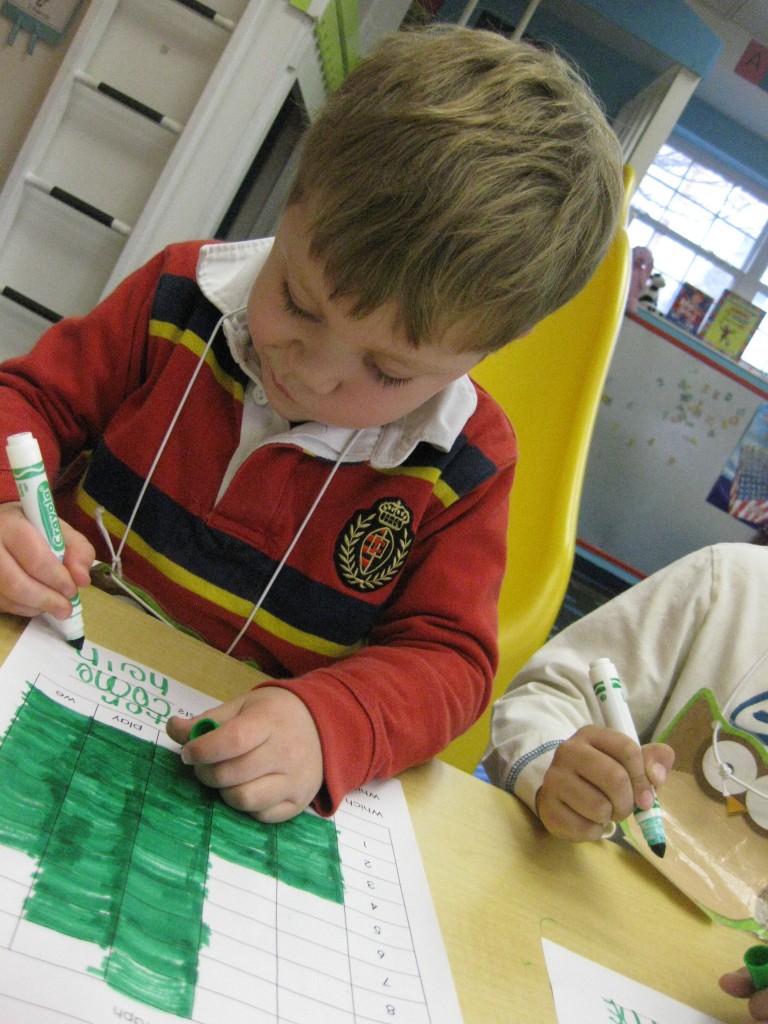
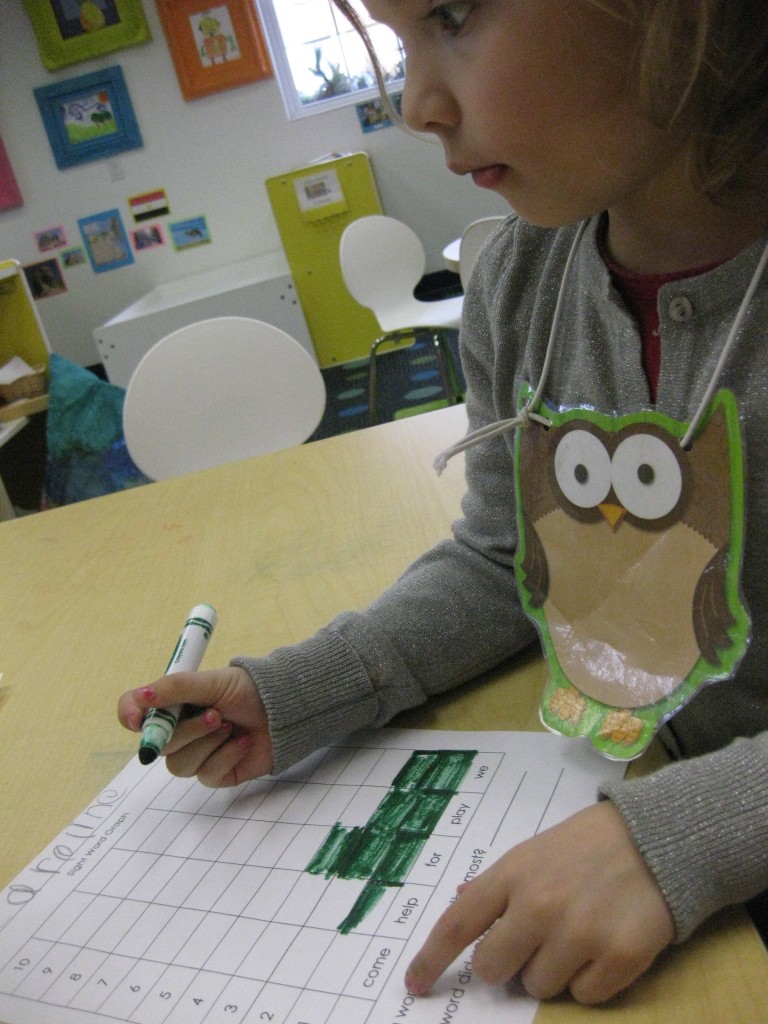
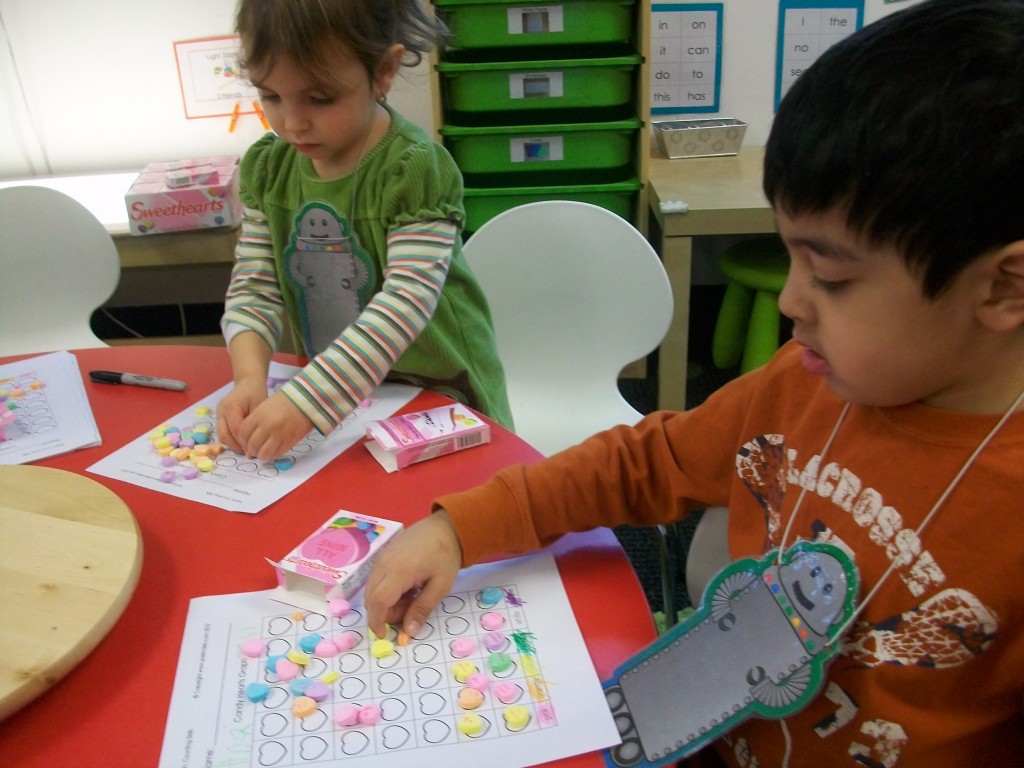
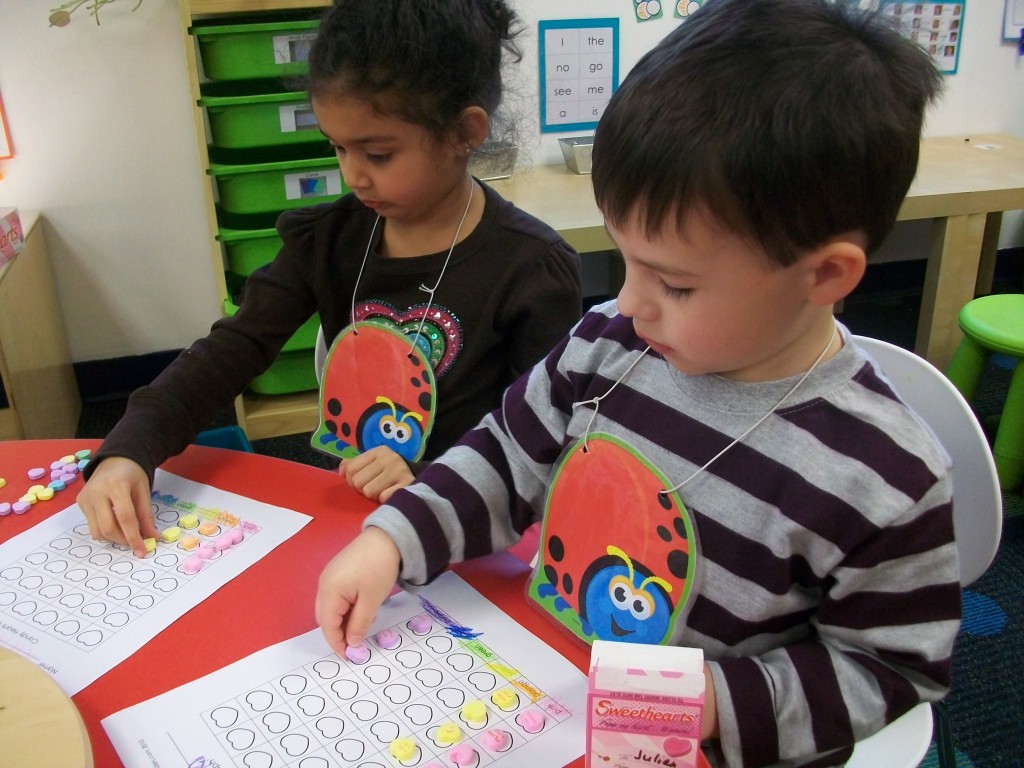
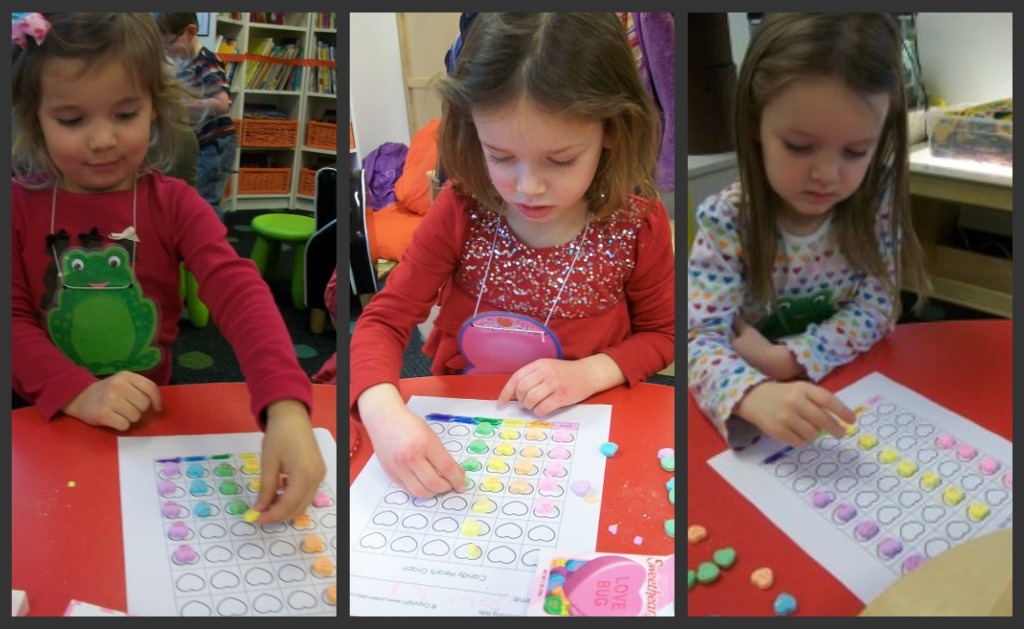
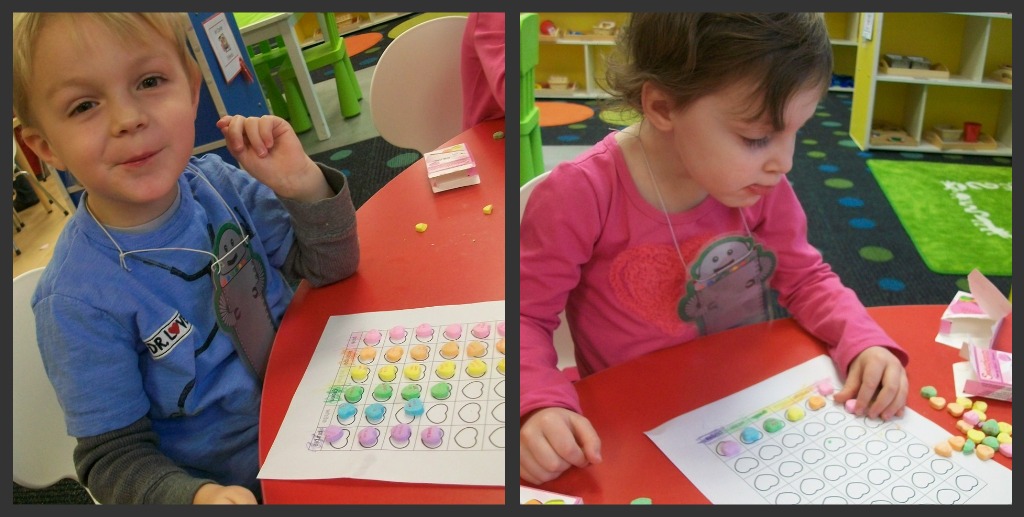
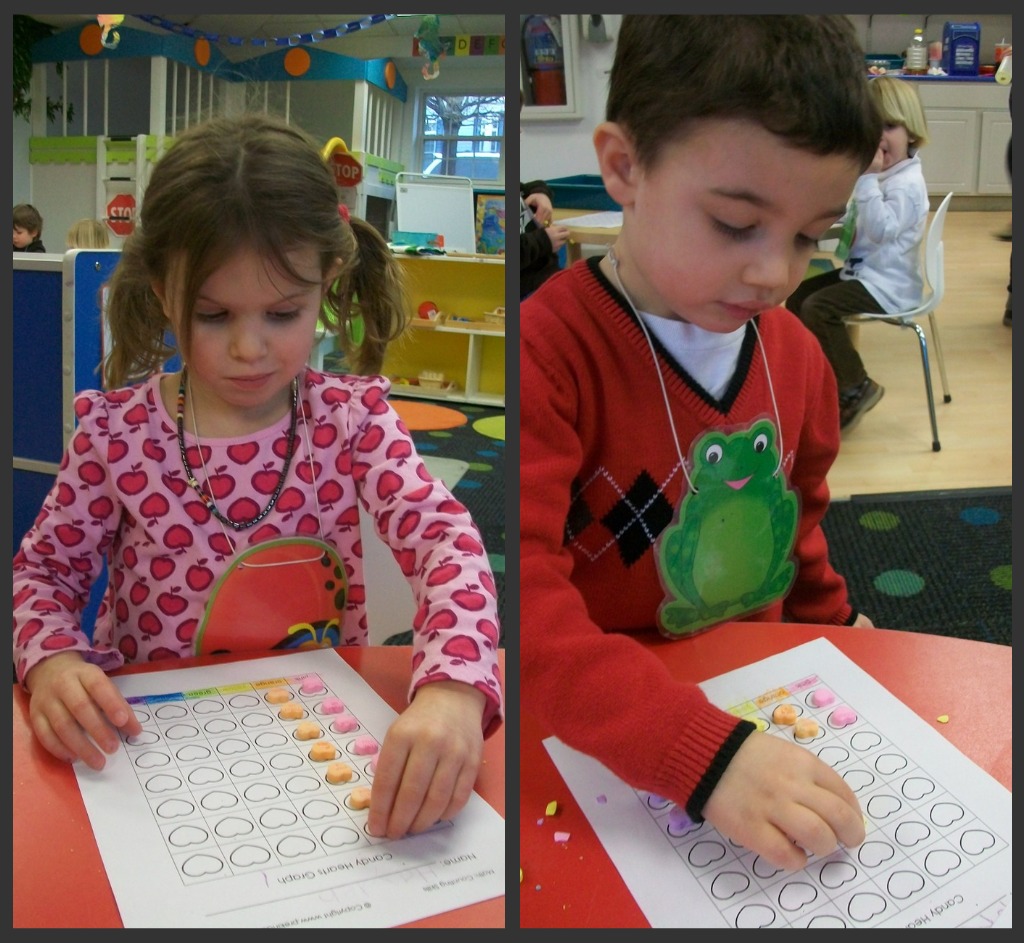
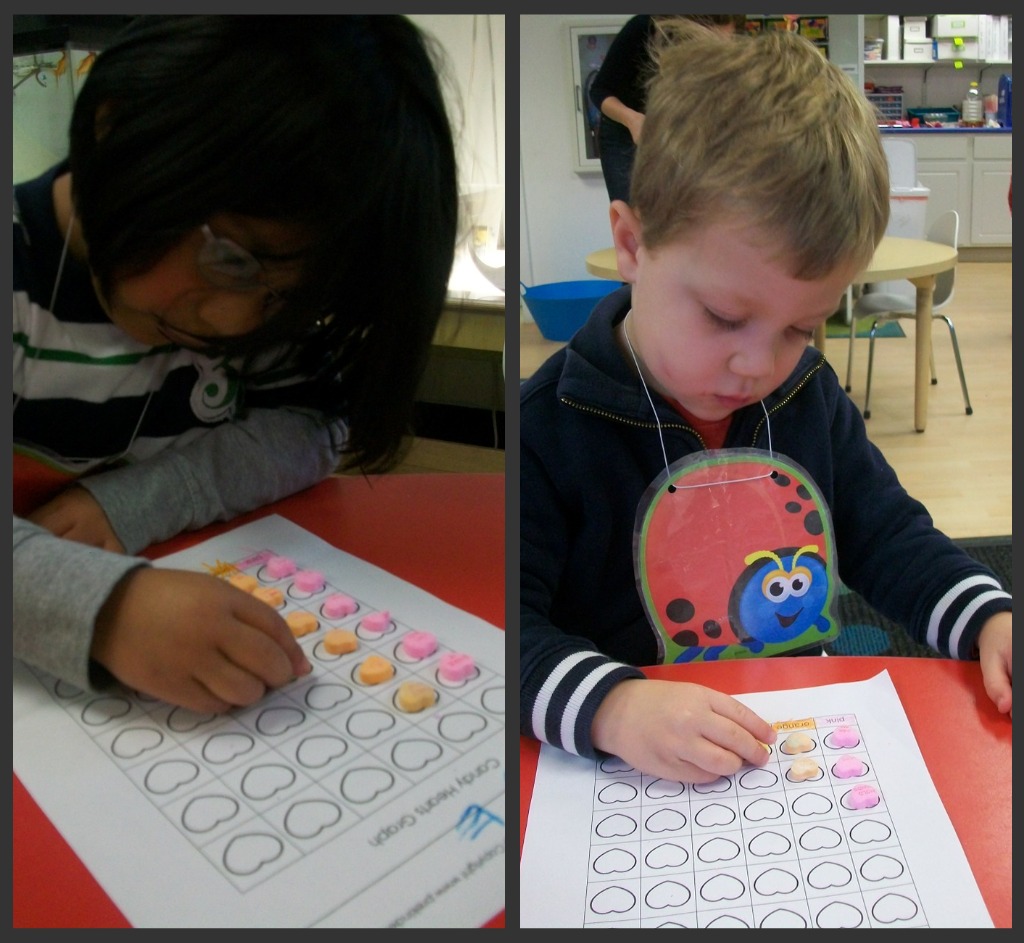
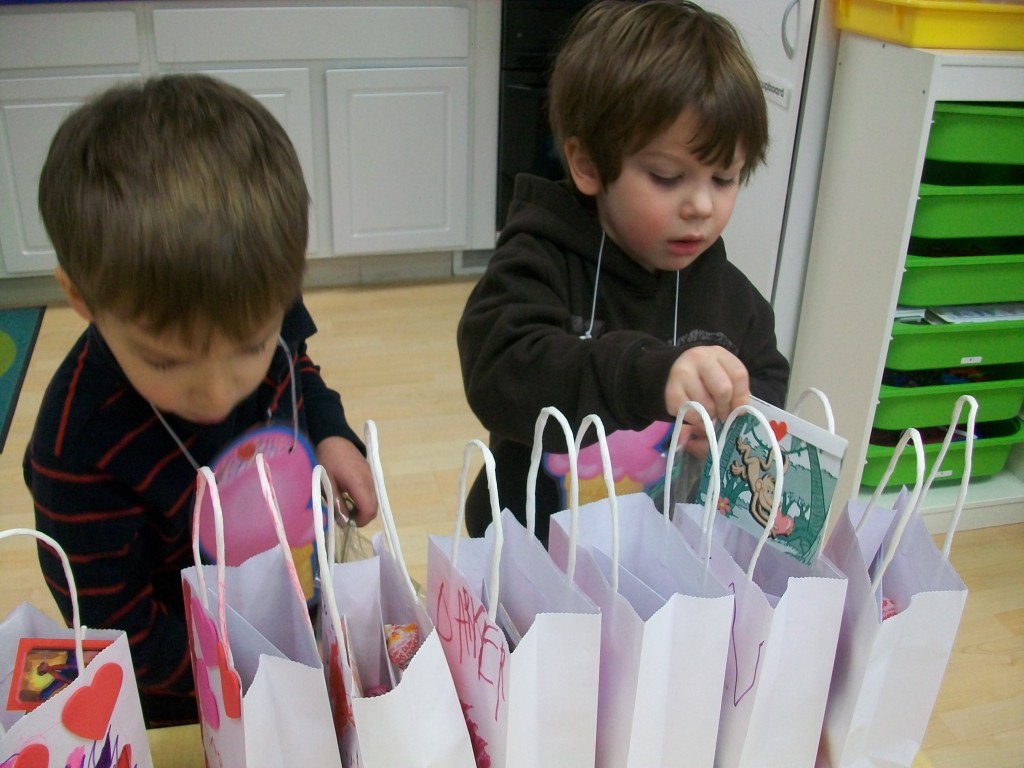
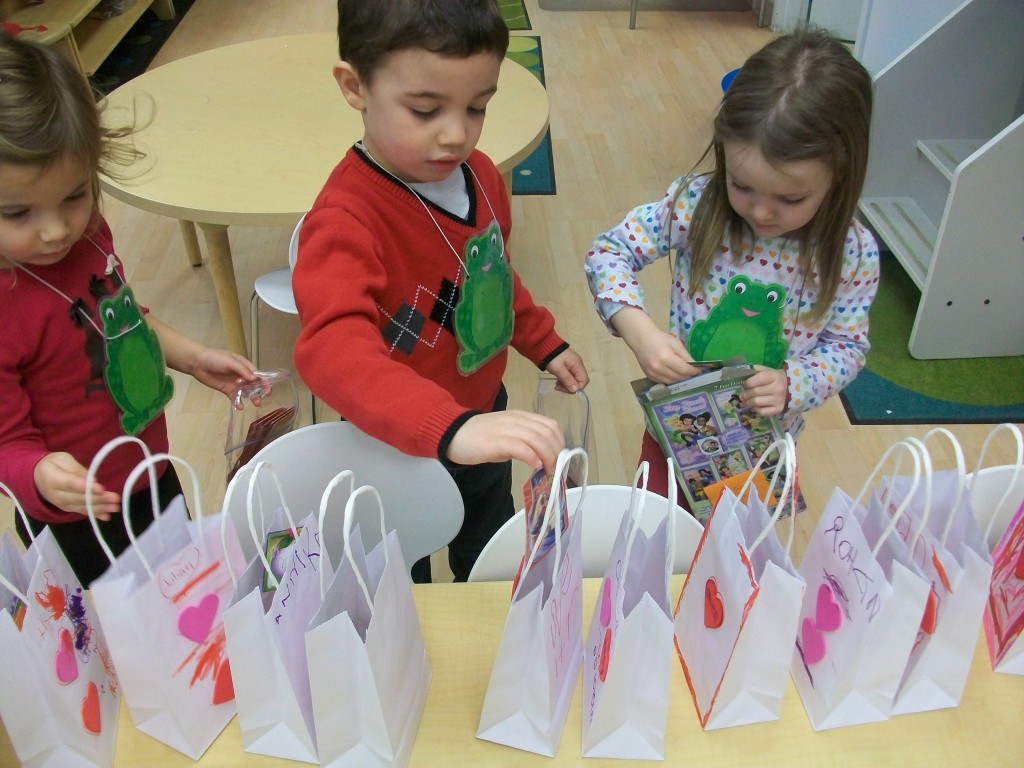
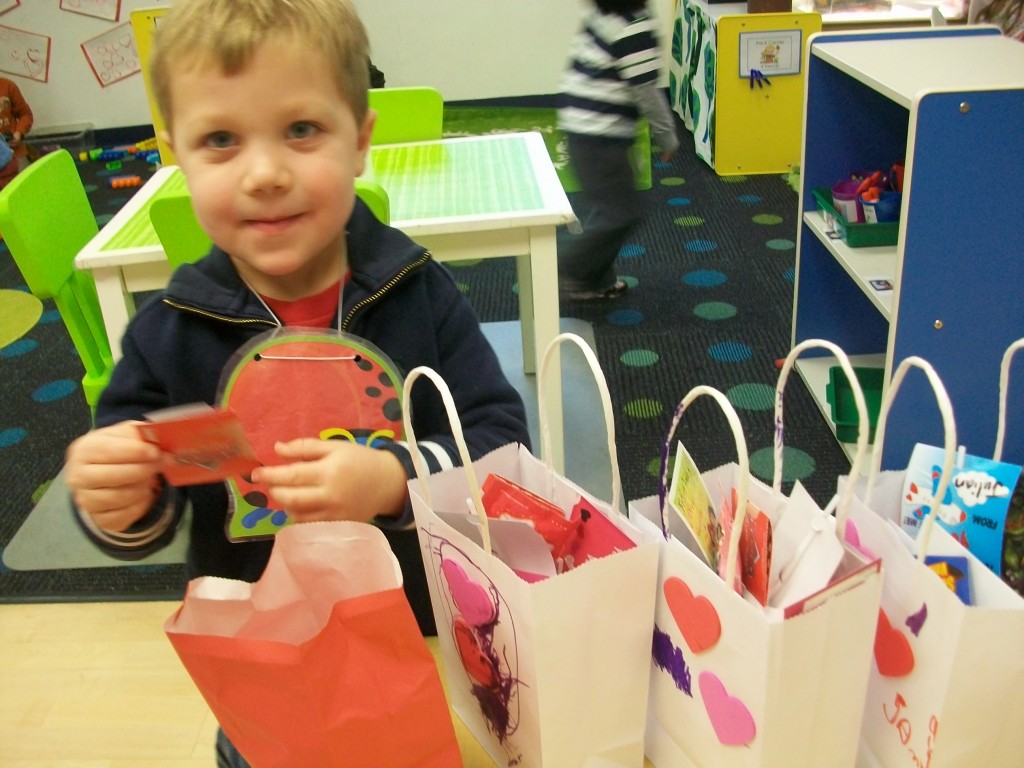
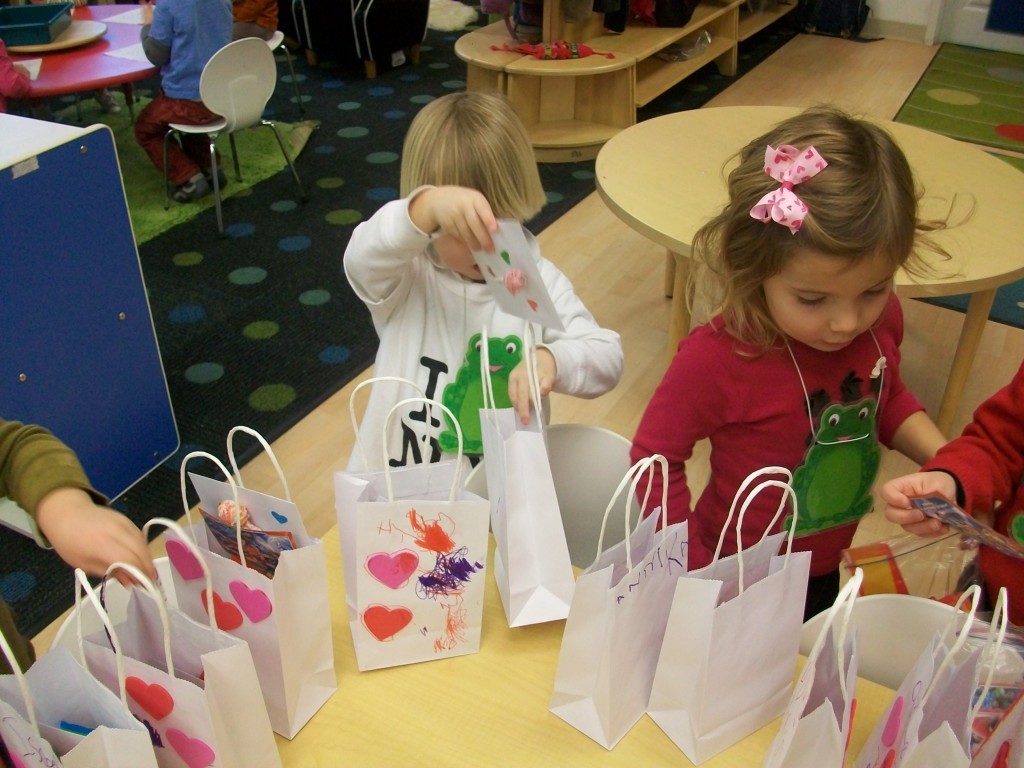
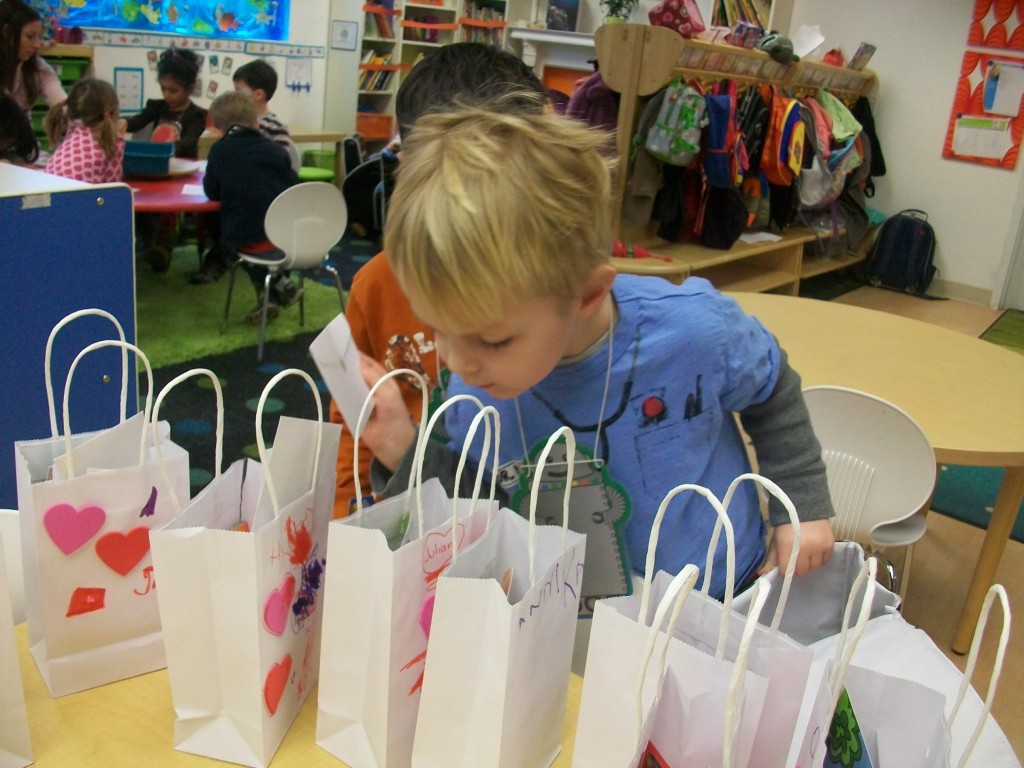
Happy Valentine’s Day! These little heart breakers had a love-filled morning with our Valentine activities. Using our color recognition and sorting skills, the boys and girls sorted their very own box of candy hearts on their candy heart graphs. Ask your little valentine how all of the hearts were sorted. The children then had the opportunity to pass out their Valentine’s to each child. The boys and girls really enjoyed celebrating friendships!
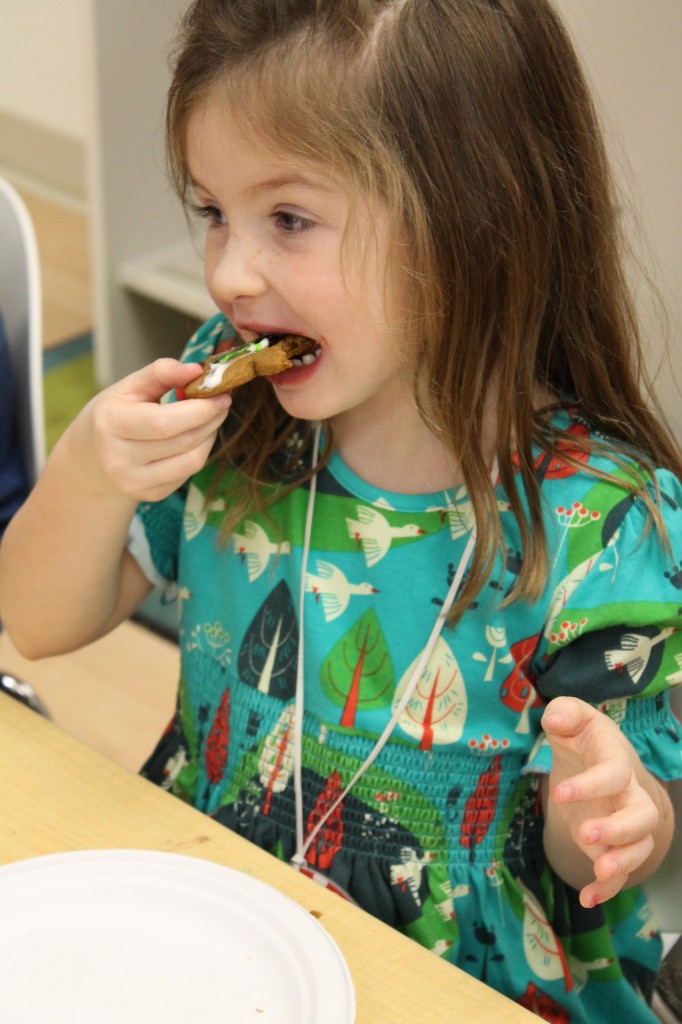
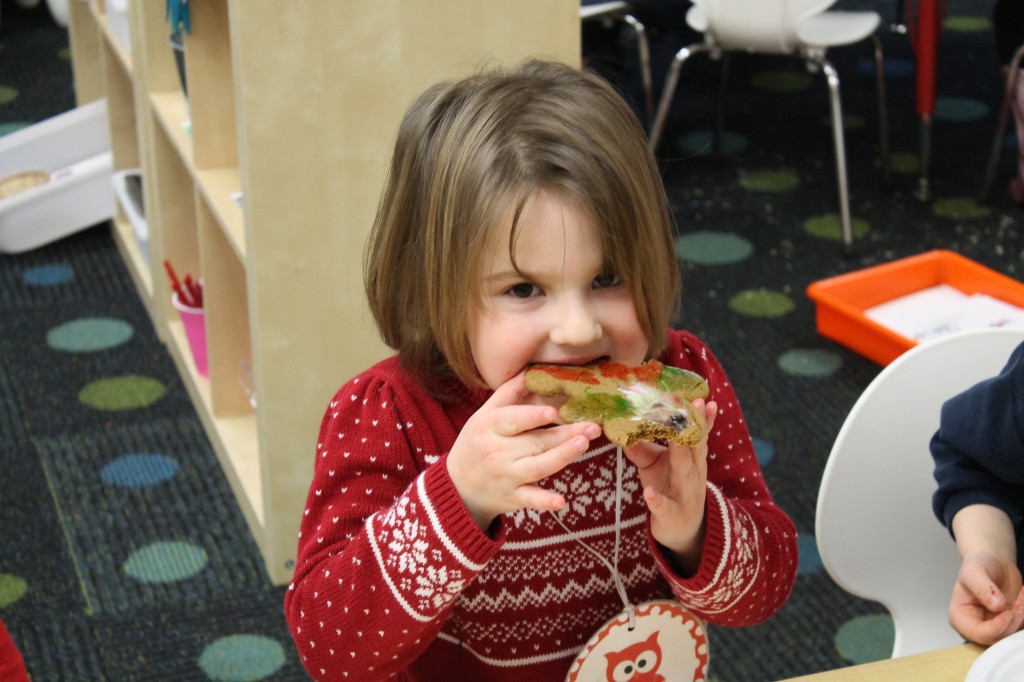
We continued our math study in small groups through the creation of a Gingerbread Graph. We took one big bite of a delicious gingergread cookie and recorded where we took our first bite on a class graph. We then compared each column by identifying which location had the most names and the least names. Looks like the leg was the winner!
We have been graphing the weather over the past three weeks and the children have been drawing their own weather cards to help keep track of our crazy Cincinnati weather. Graphing activities for Pre-K (and Kindergarten) include collecting data and organizing it in a variety of ways. This is one way we will be practicing this skill throughout the year. We will be using these weather graphs to compare and contrast the differences in our weather throughout the different months of the year. We will also be using them when we talk about the terms, Greater, Fewer, and Equal. These graphs will be used to make predictions of future weather as well. When children are making guesses (predictions) about what might happen in different situations, they are learning about probability. The more experiences they have with concrete objects or situations the more accurate their guesses will be in the future.
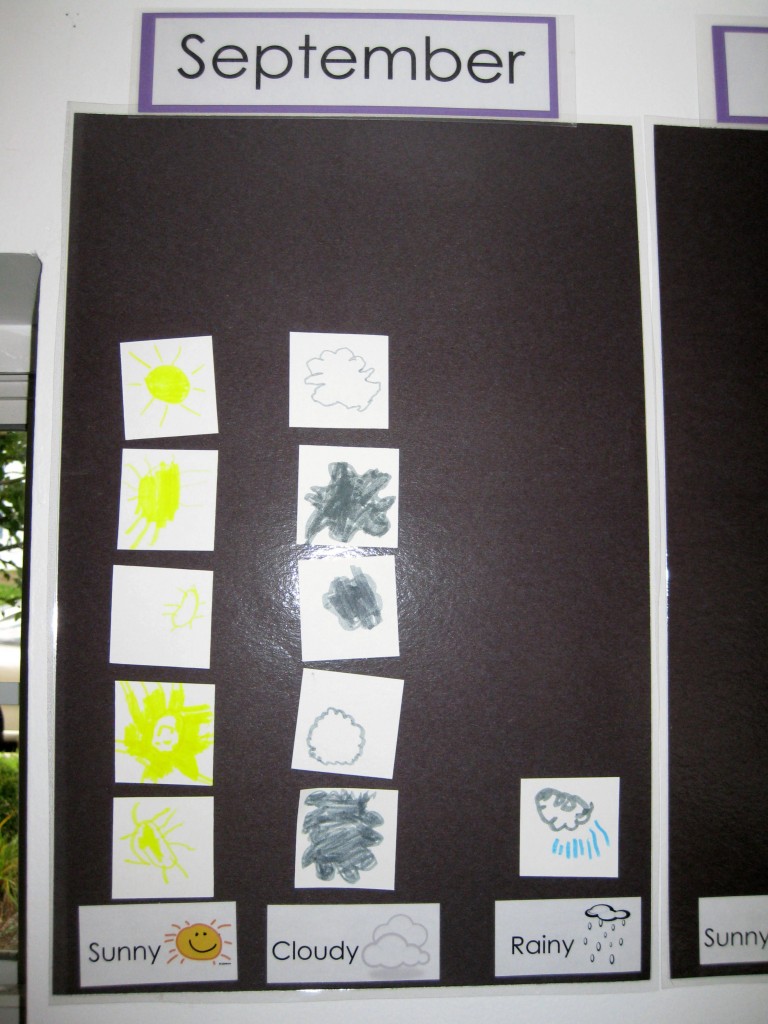

Sunny Days

Cloudy Days
Creative Tots has specialized in the private education of both toddlers and preschool age children for over 15 years. We began in the heart of Madeira and now also have a new Mason location. We are specifically designed to focus on early childhood development for children ages 18 months to 5 years.
Click below to learn more about our program offerings: