We have been graphing the weather over the past three weeks and the children have been drawing their own weather cards to help keep track of our crazy Cincinnati weather. Graphing activities for Pre-K (and Kindergarten) include collecting data and organizing it in a variety of ways. This is one way we will be practicing this skill throughout the year. We will be using these weather graphs to compare and contrast the differences in our weather throughout the different months of the year. We will also be using them when we talk about the terms, Greater, Fewer, and Equal. These graphs will be used to make predictions of future weather as well. When children are making guesses (predictions) about what might happen in different situations, they are learning about probability. The more experiences they have with concrete objects or situations the more accurate their guesses will be in the future.
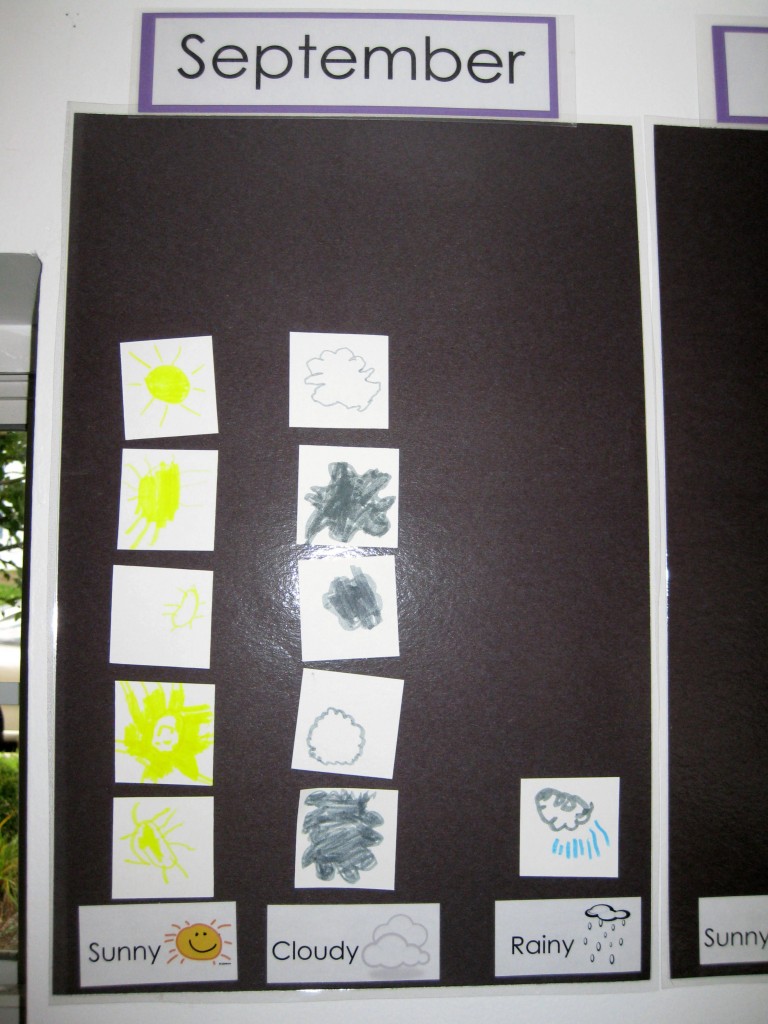

Sunny Days

Cloudy Days